Table of contents
- Executive Summary
- Background and Methods
- Trends in Drug-Related Hospitalisations among Australians
- Drug-Related Hospitalisations by Diagnosis
- Drug-Related Hospitalisations by Drug
- Drug-Related Hospitalisations by Jurisdiction
- Funding
- Acknowledgements
- Recommended citation
- Related Links
- Contact us
- Appendix
Executive Summary
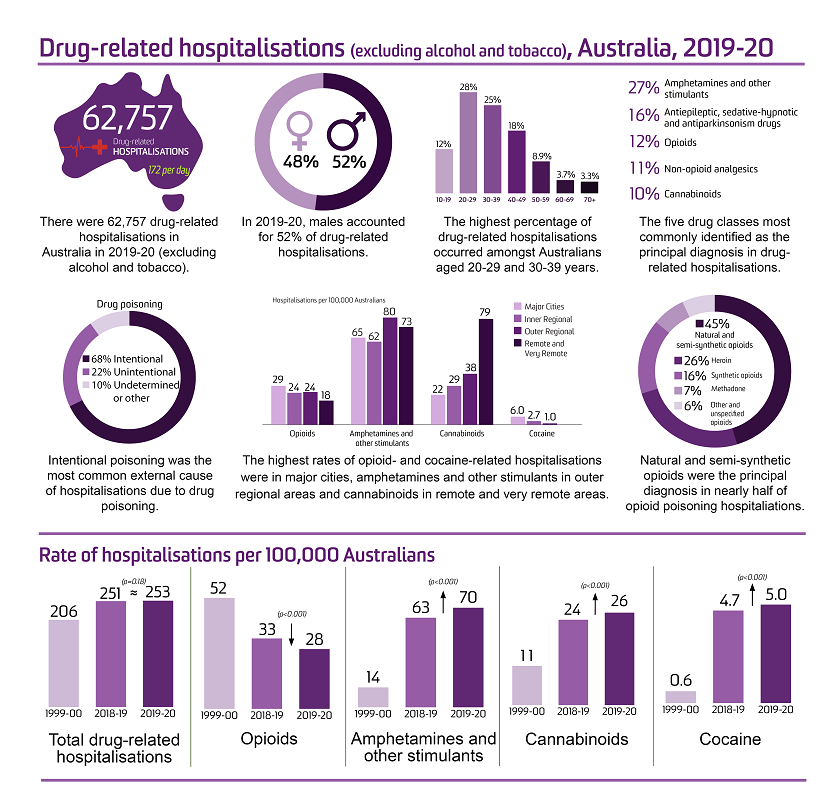
There were 62,757 drug-related hospitalisations (excluding alcohol and tobacco) among Australians in 2019-20, equivalent to 0.56% of all hospitalisations in Australia.
The age-standardised rate of drug-related hospitalisations was relatively stable between 1999-00 and 2009-10. It subsequently increased from 199 hospitalisations per 100,000 people in 2010-11 to 272 in 2015-16 and 2016-17, before declining to 250 in 2017-18. This rate remained stable in 2018-19 and 2019-20 (251 and 253 hospitalisations per 100,000 people, respectively).
Sex
In 2019-20, males accounted for 52% of drug-related hospitalisations. This is a reversal of findings up until 2014-15 where drug-related hospitalisations more commonly involved females than males.
Age
In 2019-20, the highest rates of drug-related hospitalisations continued to be observed among the 20-29 and the 30-39 age groups. The greatest increase since 1999-00 has been observed in males aged 40-49 and 50-59, with rates of drug-related hospitalisations over two times higher in 2019-20 than in 1999-00, however, the rates have been relatively stable since 2015-16. Among females, the second highest rate of drug-related hospitalisations was among those aged 10-19.
Remoteness Area of Usual Residence
In 2019-20, the majority of drug-related hospitalisations were among people residing in major cities (73% of hospitalisations where remoteness was coded), although the age-standardised rate of drug-related hospitalisations was highest in remote and very remote areas of Australia (301 hospitalisations per 100,000 people).
Principal Diagnosis
In 2019-20, psychotic disorder was the leading diagnosis among the hospitalisations related to mental and behavioural disorders due to psychoactive substance use (%), followed closely by dependence syndrome (31%).
In 2019-20, two-thirds (68%) of hospitalisations due to drug poisoning were intentional.
Drug Type
In 2019-20, the largest proportion of drug-related hospitalisations was attributable to amphetamines and other stimulants (70 hospitalisations per 100,000 people, 27% of drug-related hospitalisations), followed by antiepileptic, sedative-hypnotic and antiparkinsonism drugs (e.g., benzodiazepines; 16%), opioids (12%), non-opioid analgesics (e.g., paracetamol; 11%), and cannabinoids (%).
From 1999-00 to 2019-20, cannabinoid-related hospitalisations increased from 11 to per 100,000 people. Psychostimulant-related hospitalisations also increased in that period, with cocaine-related hospitalisations increasing from 0.6 to and amphetamines and other stimulants from 14 to hospitalisations per 100,000 people. Opioid-related hospitalisations decreased from the peak of 52 hospitalisations per 100,000 people in 1999-00 to hospitalisations per 100,000 people in 2019-20.
Compared with the previous year, 2019-20 saw a significant decrease in the rates of hospitalisations with opioids; non-opioid analgesics; and antipsychotics and neuroleptics identified under principal diagnosis (p<0.001). In contrast, there was a significant increase in hospitalisation rates due to amphetamines and other stimulants; cannabinoids; antiepileptic, sedative-hypnotic and antiparkinsonism drugs; and hallucinogens (p<0.050).
In 2019-20, natural and semi-synthetic opioids (e.g., oxycodone, morphine) were responsible for nearly half (45%) of all hospitalisations due to opioid poisoning. The rate of hospitalisations related to natural and semi-synthetic opioids almost doubled from 1999-00 to 2019-20 (3.5 to 6.0 hospitalisations per 100,000 people, respectively).
Major cities had the highest rate of opioid-related (29 per 100,000 people) and cocaine-related (6.0 per 100,000 people) hospitalisations compared to other remoteness areas, while areas had the highest rate of hospitalisations related to amphetamines and other stimulants ( hospitalisations per 100,000 people) and remote and very remote areas had the highest rate of cannabinoid-related hospitalisations (79 per 100,000 people).
Jurisdiction
From 2018-19 to 2019-20, the age-standardised rate of drug-related hospitalisations increased in the Australian Capital Territory, the Northern Territory, Queensland, South Australia, and Western Australia, decreased in Tasmania and Victoria, and remained similar in New South Wales.
Important differences in age-standardised rate of drug-related hospitalisations by sex, age group, remoteness and drug type for each jurisdiction are also reported and available in our publicly-accessible online interactive visualisation.
Background and Methods
This bulletin reports on drug-related hospitalisations (see Panel A for definition) in Australia from 1999-00 to 2019-20, with a particular focus on opioid-, amphetamine and other stimulant-, cannabinoid-, and cocaine-related hospitalisations as per the aims of the Drug Trends program. Data were extracted from the National Hospital Morbidity Database held by the Australian Institute of Health and Welfare (AIHW). Full details of the methods are available for download and should be read alongside this bulletin.
Panel A. Terminology
|
At the time of separation from hospital, a principal diagnosis and up to 99 additional diagnoses may be recorded using diagnosis codes from the International Statistical Classification of Diseases and Related Health Problems, Tenth Revision, Australian Modification (ICD-10-AM). Data presented here describe hospitalisations only where the principal diagnosis was directly attributable to use of illicit drugs (e.g., heroin), prescription medicines (e.g., antidepressants) or medicines available without a prescription (e.g., paracetamol). The data presented will therefore be an underestimate of the total number of hospitalisations related to drug use as: i) those presentations where drugs are coded as an additional diagnosis are excluded, and ii) hospitalisations where drugs contributed to the presentation but were not identified in diagnosis coding are not captured.
We have not included hospitalisations where the principal diagnosis was related to tobacco or alcohol use as they fall outside the scope of our monitoring. We acknowledge the significant harm arising from these substances, and encourage readers to refer to the National Alcohol Indicators Project and AIHW reporting for information regarding alcohol- and tobacco-related hospitalisations. It is important to note that many drug-related hospitalisations involve more than one drug (including alcohol) but may have one substance coded as the 'principal diagnosis'. Further, sometimes it is not possible to determine one substance as the primary drug leading to hospitalisation; these cases are coded and presented as 'multiple drug use' and thus will not be represented in the count of hospitalisations for a single substance.
We present findings for Australians of all ages unless otherwise indicated. The jurisdiction of hospitalisation equals the jurisdiction of usual residence as cross border hospitalisations were not provided. Hospitalisations with a care type of 'newborn' (without qualified days), and records for 'hospital boarders' and 'posthumous organ procurement' were not provided. Hospitalisations in Western Australia with a contracted patient status of 'Inter-hospital contracted patient to private sector hospital', were also not provided to adjust for separations recorded on both sides of contractual care arrangements. For Tasmania, provision of data between 2008-09 and 2015-16 was limited to drug-related hospitalisations based on selected drug-related ICD-10-AM codes (see the methods for the list of ICD-10-AM codes). Estimates of drug-related hospitalisations for this period are likely to be underestimated. Data regarding remoteness area of usual residence were not available for Queensland from 2012-13 to 2017-18. For this reason, we present data by remoteness area in Australia for the years 2018-19 and 2019-20 only.
We provide numbers, age-standardised rates per 100,000 people (computed using the direct method based on the Australian Standard Population at 30 June 2001), and crude rates per 100,000 people (calculated using the Australian Bureau of Statistics' estimated resident population figures as at 30 June each year) of hospitalisations. Values for small numbers of hospitalisations (less than or equal to 5) are suppressed. In accordance with recommendations to ensure stability of age-standardised rates from sparse data, age-standardised rates were not calculated if the total number of hospitalisations was less than or equal to 10. Estimates presented for specific age-groups were computed only as crude rates per 100,000 people. Tests of statistically significant change have been conducted between estimates for 2019-20 compared to 2018-19 only; significance level was set at p<0.050.
An accompanying online interactive data visualisation allows disaggregation of data in many different ways, and download of these images. Estimates can be viewed disaggregated by drug, jurisdiction, remoteness, sex, age group and diagnosis, and as numbers or crude or age-standardised rates per 100,000 population (with 95% confidence intervals).
Trends in Drug-Related Hospitalisations among Australians
In 2019-20 there were 11.1 million hospitalisations in Australia's public and private hospitals. There were 62,757 hospitalisations with a drug-related principal diagnosis (excluding alcohol and tobacco) among Australians of all ages in 2019-20, equivalent to 0.56% of all hospitalisations and an average of 172 hospitalisations per day. Relative to population size and adjusting for age distribution, we estimate that there were 253 drug-related hospitalisations per 100,000 people in 2019-20 (Figure 1).
The age-standardised rate of drug-related hospitalisations was relatively stable between 1999-00 and 2009-10. We observed an increase in the age-standardised rate of drug-related hospitalisations from 199 in 2010-11 to 272 hospitalisations per 100,000 people in both 2015-16 and 2016-17. The rate then decreased to 250 hospitalisations per 100,000 people in 2017-18, and remained similar in 2018-19 (251 hospitalisations per 100,000 people) and 2019-20 (253 hospitalisations per 100,000 people; p=0.181) (Table 1).
Figure 1. Age-standardised rate per 100,000 people of drug-related hospitalisations among the total Australian population and for males and females, 1999-00 to 2019-20.
Sociodemographic Characteristics of Drug-Related Hospitalisations
Sex
In 2019-20, the age-standardised rate of drug-related hospitalisations was higher for males compared to females (264 versus 242 hospitalisations per 100,000 people), with 52% of hospitalisations occurring among males. The difference was larger than observed in 2018-19 (51% male), and is a reversal of findings up until 2014-15 where the rate of drug-related hospitalisations was higher for females than males (Figure 1).
There was a significant increase in drug-related hospitalisations among males in 2019-20 compared with 2018-19 (p<0.001) from 259 to 264 hospitalisations per 100,000 people while the decrease among females was not statistically significant (p=0.419) (Table 1).
Age
The highest crude rate of hospitalisations has consistently been observed amongst the 20-29 age group, followed by the 30-39 age group (491 and 412 hospitalisations per 100,000 people in 2019-20, respectively) (Figure 2). In 2019-20, these age groups accounted for the greatest percentage of drug-related hospitalisations (28% and 25%, respectively), followed by the 40-49 (18%), 10-19 (12%), 50-59 (8.9%), 60-69 (3.7%) and 70 and over (3.3%) age groups.
There was a significant increase in drug-related hospitalisations in the two youngest age groups (i.e., 10-19 and 20-29) in 2019-20 compared with 2018-19 (251 and 491 versus 240 and 466 hospitalisations per 100,000 people; p=0.005 and p<0.001, respectively). In contrast, a decrease in the rate of hospitalisations was observed in the 40-49 and 60-69 age groups (334 and 86 versus 344 and 98 hospitalisations per 100,000 people; p=0.032 and p<0.001, respectively) (Table 2).
Figure 2. Crude rate per 100,000 people of drug-related hospitalisations among the female (A), male (B) and total (C) Australian population, by age group, 1999-00 to 2019-20.
Note: The rates for the 0-9 years age group are not presented due to sensitivity of the data.
Sex and Age
The crude rate of drug-related hospitalisations increased across most age groups for both males and females from 1999-00 to 2019-20. The greatest increase has been observed in males aged 40-49 and 50-59, with the rates of drug-related hospitalisations over two times higher in 2019-20 than in 1999-00. However, the highest rate of drug-related hospitalisations in 2019-20 was observed amongst the male 20-29 and 30-39 age groups, followed by the female 20-29 age group (508, 498, and 472 hospitalisations per 100,000 people, respectively) (Figure 2).
Compared with 2018-19, there was a significant increase in the rate of drug-related hospitalisations among males aged 10-19 (p<0.001) and 20-29 (p=0.006) in 2019-20. There was also a significant increase in the rate of drug-related hospitalisations among females aged 20-29 (p<0.001), while the rates among females aged 50-59 and 60-69 decreased significantly (p=0.003 and p<0.001, respectively) compared to 2018-19 (Table 3).
Remoteness Area of Usual Residence
Remoteness area of usual residence (hereafter 'remoteness') could not be identified in 2.9% of hospitalisations in 2019-20.
In 2019-20, the majority of hospitalisations were among people residing in major cities (44,629 hospitalisations; 73% of hospitalisations with remoteness identified). By contrast, the age-standardised rate was lowest in major cities (240 hospitalisations per 100,000 people) and highest in remote and very remote areas (301 hospitalisations per 100,000 people), followed by outer regional areas (295 hospitalisations per 100,000 people) and inner regional areas (242 hospitalisations per 100,000 people). This represents a shift in rates when compared to 2018-19 where the highest rate was recorded in outer regional areas, followed by remote and very remote areas (292 and 282 hospitalisations per 100,000 people, respectively) (Table 4).
Remoteness and Sex
In 2019-20, rates of drug-related hospitalisations were higher among males than females in major cities (256 per 100,000 people and 225 per 100,000 people, respectively) and remote and very remote (311 per 100,000 people and 291 per 100,000 people, respectively) areas. Conversely, rates of drug-related hospitalisations were higher among females than males in inner regional (246 per 100,000 people and 239 per 100,000 people, respectively) and outer regional (314 per 100,000 people and 277 per 100,000 people, respectively) areas (Figure 3).
In 2019-20, the rate of drug-related hospitalisations among males significantly increased compared to 2018-19 in all remoteness areas (p<0.001). For females, a significant increase was observed in remote and very remote area (p<0.001) and a significant decrease was observed in inner regional area (p=0.049) (Table 4).
Figure 3. Rate per 100,000 people of drug-related hospitalisations among the Australian population, by remoteness, sex and age group, 2018-19 and 2019-20.
Remoteness and Age
The highest rate of hospitalisations was observed among the 20-29 age group in all remoteness areas; however, the rates were higher in remote and very remote (703 hospitalisations per 100,000 people) and outer regional (582 hospitalisations per 100,000 people) areas compared to inner regional areas (501 hospitalisations per 100,000 people) and major cities (460 hospitalisations per 100,000 people). A similar picture was observed for the younger group (10-19 years; 394, 340, 266 and 229 hospitalisations per 100,000 people, respectively). By contrast, the older age groups (60-69 and 70+) in major cities recorded a higher rate of hospitalisations as compared to other areas (Figure 3).
In 2019-20, the rate of hospitalisations increased significantly compared to 2018-19 for the 10-19 and 20-29 age groups in major cities (p<0.050). Conversely, a significant decrease in rates was observed for older age groups in certain areas; specifically, for the 40-49 and 60-69 age groups in major cities, the 50-59 and 60-69 age groups in inner regional areas and the 70+ age group in outer regional areas (p<0.050) (Table 5).
Drug-Related Hospitalisations by Diagnosis
In 2019-20, diagnoses of mental and behavioural disorder due to substance use were identified in 53% of all drug-related hospitalisations, while drug poisoning accounted for 46%. Between 1999-00 and 2009-10, the rate of drug poisoning-related hospitalisations was twice the rate of hospitalisations related to mental and behavioural disorder due to substance use. Since 2010-11, this difference has gradually been getting smaller, with an increasing number of hospitalisations related to mental and behavioural disorder due to substance use. Caution, however, should be used in comparing diagnosis over time, as the classifications and coding standards for those data can change over time.
Principal Diagnosis of Mental and Behavioural Disorder Due to Substance Use
Among hospitalisations with a principal diagnosis from the group of ICD-10-AM codes indicating mental and behavioural disorder due to substance use, psychotic disorder was the leading diagnosis in 2019-20 (%) followed closely by dependence syndrome (31%). Hospitalisations with a principal diagnosis of harmful use, acute intoxication, withdrawal state and other use disorder accounted for the remaining 30% of hospitalisations coded to the ICD-10-AM diagnoses of 'mental and behavioural disorder due to substance use' (Figure 4).
There was a substantial increase in the rate of hospitalisations with a principal diagnosis of a drug-related psychotic disorder, increasing over four-fold between 2009-10 (12 per 100,000 people) and 2019-20 ( per 100,000 people), and with a significant increase recorded in 2019-20 compared to 2018-19 (). An overall increase from 1999-00 to 2018-19 was also observed in the rates of hospitalisations with a principal diagnosis of acute intoxication and harmful use; however, the latter has decreased in 2019-20 (p<0.001), while acute intoxication continued to increase (p<0.001) (Table 6). The rates of withdrawal-related hospitalisations remained law over the course of monitoring, ranging between 4.9 and 10 hospitalisations per 100,000 people, with a significant decrease recorded between 2018-19 and 2019-20. (p=0.002).
Figure 4. Age-standardised rate per 100,000 people of drug-related hospitalisations among the Australian population, by principal diagnosis of mental and behavioural disorder due to substance use (A) and external cause of poisoning (B), 1999-00 to 2019-20.
Note: Age-standardised rates were not calculated if the number of hospitalisations was less than or equal to 10 (please refer to our methods document for details). Suppressed data are visible as gaps in the data series.
Sex
Males have had a higher rate of hospitalisations with a principal diagnosis of a mental and behavioural disorder due to substance use than females over the course of monitoring (171 versus 100 hospitalisations per 100,000 people in 2019-20). This has been consistent across all diagnoses within this cluster of ICD-10-AM codes.
In 2019-20 as compared to 2018-19, rates of hospitalisations increased among males and females with principal diagnosis of acute intoxication (17 and 9.2 in 2018-19 to 20 and 12 per 100,000 people in 2019-20, respectively; p<0.001) and psychotic disorder ( and in 2018-19 to and per 100,000 people in 2019-20, respectively; ) and among males with dependence (51 in 2018-19 to 53 per 100,000 people in 2019-20; p=0.004).
A significant decrease in rates of hospitalisations was observed among both males and females with a principal diagnosis of harmful use (25 and 14 in 2018-19 to 21 and 13 per 100,000 people in 2019-20, respectively; p<0.001), among males with withdrawal (11 in 2018-19 to 9.3 per 100,000 people in 2019-20; p<0.001) and females with other mental and behavioural disorder due to substance use (1.5 in 2018-19 to 1.2 per 100,000 people in 2019-20; p=0.004) (Table 6).
Age
In 2019-20, the rate of hospitalisations with a mental and behavioural disorder due to substance use as the principal diagnosis was highest among people aged 20-29 and 30-39 (297 and 279 hospitalisations per 100,000 people, respectively).
In 1999-00, the rate of hospitalisations in the 20-29 age group was twice the rate in the 30-39 age group (264 versus 125 per 100,000 people). Rates for these two age groups converged by 2009-10 (148 and 150 per 100,000 people, respectively), subsequently typically increasing, including a significant increase from 2018-19 to 2019-20 in the 20-29 age group (277 to 297 hospitalisations per 100,000 people; p<0.001). In 2019-20, the rate for the 20-29 age group was the highest since monitoring began.
Rates in 40-49 and 50-59 age groups increased 4-fold over the time of monitoring (49 and 17 hospitalisations per 100,000 people in 1999-00 to 198 and 76 per 100,000 people in 2019-20, respectively). A similar trend was observed in the 60-69 age group up until 2015-16 with the rate increasing from 7.0 in 1999-00 to 40 hospitalisations per 100,000 people in 2015-16. In more recent years, the rate has declined including a significant decrease from 2018-19 to 2019-20 (32 to 26 hospitalisations per 100,000 people; p<0.001) (Table 7).
Remoteness Area of Usual Residence
In 2019-20, the rate of hospitalisations with a principal diagnosis of mental and behavioural disorder due to substance use was highest in remote and very remote areas (170 per 100,000 people) and lowest in inner regional areas (114 per 100,000 people). It varied, however, depending on the principal diagnosis. The rate of dependence-related hospitalisations was highest in major cities (48 per 100,000 people) and lowest in remote and very remote areas (9.2 per 100,000 people). Psychotic disorder and withdrawal-related hospitalisations were highest in remote and very remote areas (100 and 19 hospitalisations per 100,000 people, respectively) and lowest in major cities (44 and 7 hospitalisations per 100,000 people, respectively). Rates of harmful use and acute intoxication hospitalisations were also highest in remote and very remote areas (21 and 17 per 100,000 people).
Between 2018-19 and 2019-20, an increase in rates of hospitalisation due to psychotic disorder was recorded in all remoteness areas (p<0.001). Dependence syndrome-related hospitalisations increased in inner regional and outer regional areas, while a decrease in rates was observed in remote and very remote Australia. Harmful use-related hospitalisations increased in all remoteness areas except major cities, where a significant decrease in rates was recorded (p<0.001). Acute intoxication hospitalisations significantly increased in major cities, inner and outer regional areas (p<0.001). Withdrawal-related hospitalisations decreased in major cities and inner regional areas but increased in outer regional areas (p<0.050) (Table 8).
Principal Diagnosis of Drug Poisoning
Over the course of monitoring, about two-thirds of drug poisonings were intentional (68% in 2019-20).
The rate of intentional drug poisoning was relatively stable between 1999-00 and 2014-15 varying between 77 and 88 hospitalisations per 100,000 people; however, it peaked at 102 hospitalisations per 100,000 people in 2016-17. Since then, the rate has fallen again to 81 hospitalisations per 100,000 people in 2019-20, a significant decrease compared to 2018-19 (85 hospitalisations per 100,000 people; p<0.001) (Figure 4; Table 9).
By contrast, the rate of hospitalisations for unintentional drug poisoning has remained relatively stable (between 22 and 28 hospitalisations per 100,000 people) since 2005-06.
Sex
In 2019-20, 67% of intentional drug poisoning hospitalisations were among females. The rate of intentional drug poisoning among females was double that observed among males over the course of monitoring (109 and 53 per 100,000 people, respectively, in 2019-20). However, the rate of intentional drug poisonings among females in 2019-20 represents a significant decline relative to 2018-19 116 per 100,000 people (p<0.001). By contrast, unintentional drug poisoning hospitalisations were more common among males than females in 2019-20 (54% versus 46%; 28 and 23 per 100,000 people, respectively), but this has fluctuated over the years. Males showed a significant increase in rates of unintentional poisoning hospitalisations from 26 per 100,000 people in 2018-19 to 28 per 100,000 people in 2019-20 (p=0.019) (Table 9).
Age
In 2019-20, intentional drug poisoning was most common among people aged 20-29 (26%, 143 per 100,000 people) and 10-19 (23%, 150 per 100,000 people). The rate of hospitalisations for the 10-19 age group started increasing substantially from 2007-08 (99 per 100,000 people) and in 2012-13 overtook the rate observed among the 20-29 age group (159 and 127 per 100,000 people) (Table 10).
In 2019-20, people aged 20-29 had the highest rate of hospitalisations due to unintentional poisoning (34 per 100,000 people), followed by those aged 40-49 and 30-39 (29 and 23 per 100,000 people, respectively) (Table 10). Between 1999-00 and 2011-12, the rates of hospitalisation due to unintentional poisoning decreased in the 10-19, 20-29, 30-39 and 40-49 age groups (from 33, 73, 49 and 32 per 100,000 people to 16, 29, 30 and 23 per 100,000 people, respectively). From 2012-13 until 2019-20, rates of hospitalisations due to unintentional poisoning stabilised for age group 10-19 and in 2019-20 they had the lowest rate of unintentional poisoning among all age groups (16 per 100,000 people). In contrast, rates of hospitalisations for people aged 20-29, 30-39 and 40-49 showed an increasing trend between 2012-13 until 2015-16, before declining again. In the older age groups (50-59, 60-69 and 70+) rates of hospitalisation have steadily increased since 1999-00, reaching their highest levels in 2017-18, with the highest increase observed in the 70+ age group (14 per 100,000 people in 1999-00 to 28 in 2017-18).
Remoteness Area of Usual Residence
In 2019-20, the rate of hospitalisations due to intentional drug poisoning was highest in outer regional areas (116 hospitalisations per 100,000 people) and lowest in major cities (73 hospitalisations per 100,000 people). A decline in hospitalisation rates due to intentional drug poisoning was observed in inner and outer regional areas (p<0.001) and in remote and very remote areas (p=0.001) between 2018-19 and 2019-20 (Table 11).
In contrast, the rate of hospitalisations due to unintentional drug poisoning was highest in remote and very remote areas (34 hospitalisations per 100,000 people) and lowest in inner regional Australia (21 hospitalisations per 100,000 people). No significant changes were observed in rates for any of the remoteness areas for 2019-20 compared to 2018-19 (Table 11).
Drug-Related Hospitalisations by Drug
In 2019-20, the largest number of drug-related hospitalisations among the Australian population were attributable to amphetamines and other stimulants (17,044 hospitalisations, 70 per 100,000 people, 27% of all drug-related hospitalisations), followed by antiepileptic, sedative-hypnotic and antiparkinsonism drugs (e.g., benzodiazepines; 16%), opioids (12%), non-opioid analgesics (e.g., paracetamol, 11%), and cannabinoids (%). The remaining drug classes comprised less than % of drug-related hospitalisations each (Figure 5).
From 1999-00 to 2013-14, the highest age-standardised rate of drug-related hospitalisations was observed for a principal diagnosis indicating antiepileptic/sedative-hypnotic/antiparkinsonism drugs, followed typically by opioids. The rate of hospitalisations with a principal diagnosis indicating amphetamines and other stimulants (e.g., methamphetamine, MDMA) increased five-fold from 2009-10 (13 hospitalisations per 100,000 people) to 2015-16 (64 hospitalisations per 100,000 people). Since 2014-15, the rate of hospitalisations for amphetamines and other stimulants has surpassed the rate observed for opioids, and in 2019-20 it reached its highest level (70 hospitalisations per 100,000 people).
There has been a decline in the rate of hospitalisations with a principal diagnosis related to antiepileptic, sedative-hypnotic and antiparkinsonism drugs, from a peak of 56 hospitalisations per 100,000 people in 2000-01 to 37 hospitalisations per 100,000 people in 2018-19, although this increased significantly in 2019-20 (41 hospitalisations per 100,000 people; p<0.001). In 2019-20, nearly half of hospitalisations related to antiepileptic, sedative-hypnotic and antiparkinsonism drugs involved benzodiazepines (%, hospitalisations, hospitalisations per 100,000 people).
In contrast, after increasing between 1999-00 and 2016-17, the rate of non-opioid analgesic hospitalisations has shown a recent decrease. Specifically, the rate of hospitalisations decreased from 39 to 27 hospitalisations per 100,000 people from 2016-17 to 2019-20, which is comparable to what was observed in 1999-00 (25 hospitalisations per 100,000 people).
The rate of cannabinoid-related hospitalisations increased from 1999-00 to 2019-20 (11 to 26 hospitalisations per 100,000 people, respectively). Similarly, cocaine-related hospitalisations have increased over time. Specifically, although the number of hospitalisations related to cocaine remained relatively low (1,241 in 2019-20), the age-standardised rate in 2019-20 was over six times the rate in 2010-11 (5.0 versus 0.8 per 100,000 people).
Compared with the previous year, 2019-20 saw significant decreases in the rate of hospitalisations with principal diagnosis related to opioids (p<0.001), non-opioid analgesics (p<0.001), and antipsychotics and neuroleptics (p=0.001). In contrast, there were significant increases in the rate of hospitalisations with amphetamines and other stimulants (p<0.001), antiepileptic, sedative-hypnotic and antiparkinsonism drugs (p<0.001), cannabinoids (p<0.001), and hallucinogens (p=0.037) identified under principal diagnosis (Table 14).
Figure 5. Age-standardised rate per 100,000 people of drug-related hospitalisations among the Australian population, by drug identified in the principal diagnosis, 1999-00 to 2019-20.
Drug Type and Remoteness Area of Usual Residence
In 2019-20, amphetamine and other stimulants was the most common drug class identified as the principal diagnosis for drug-related hospitalisations in all areas, except for remote and very remote areas where cannabinoid-related hospitalisations were the most common (Figure 6).
The rate of cannabinoid-related hospitalisations in remote and very remote areas (79 per 100,000 people) was two times higher than in outer regional areas (38 per 100,000 people), over two times higher than in inner regional areas (29 per 100,000 people) and nearly three times higher than in major cities (22 per 100,000 people). Rates of hospitalisations related to volatile solvents were also highest in the remote and very remote areas (11 per 100,000 people, respectively), while cocaine, opioids and antiepileptic, sedative-hypnotic and antiparkinsonism drugs had the highest rates in major cities (6.0, 29 and 42 per 100,000 people, respectively).
Comparison of the rate of hospitalisations in 2018-19 versus 2019-20 by remoteness area and drug type can be found in Table 15 but are discussed in more detail in the subsequent sections concentrated on specific drugs.
Figure 6. Age-standardised rate per 100,000 people of drug-related hospitalisations, by drug type identified in the principal diagnosis and remoteness area, among the Australian population, 2019-20.
Note: Age-standardised rates were not shown for remote and very remote areas with some drug types because the number of hospitalisations was less than or equal to 10. Please refer to our methods document for details.
Opioid-Related Hospitalisations
The following findings describe opioid-related hospitalisations due to illicit opioids (e.g., heroin), opioids used for the treatment of pain (e.g., oxycodone) and opioids used for the treatment of opioid dependence (e.g., methadone). In 2019-20, there were 7,295 hospitalisations with a principal diagnosis related to opioids (28 hospitalisations per 100,000 people). A slow but stable decrease in the rate of opioid-related hospitalisations has been observed since 2016-17. The decrease in age-standardised rate of opioid-related hospitalisations in 2019-20 compared to 2018-19 (33 hospitalisations per 100,000 people) was statistically significant (p<0.001) (Table 14).
Sex
There were more opioid-related hospitalisations among males than females in 2019-20 (34 versus 23 hospitalisations per 100,000 people), with 58% of opioid-related hospitalisations occurring among males. This trend has been consistent over time, although the difference in the age-standardised rate of opioid-related hospitalisations between males and females was smaller in 2019-20 as compared to 1999-00. Despite these sex differences, the rate of opioid-related hospitalisations among both males and females significantly decreased in 2019-20 compared to 2018-19 (38 and 29 per 100,000 people; p<0.001) (Table 1).
Age
In 2019-20, the highest rate of opioid-related hospitalisations occurred among the 40-49 age group (1,684 hospitalisations; 23%; 51 hospitalisations per 100,000 people), followed by the 30-39 age group (1,799 hospitalisations; 25%; 48 hospitalisations per 100,000 people), 50-59 age group (1,159 hospitalisations; 16%; 37 hospitalisations per 100,000 people), 20-29 age group (1,172 hospitalisations; 16%; 32 hospitalisations per 100,000 people), 60-69 age group (646 hospitalisations; 8.9%; 24 hospitalisations per 100,000 people), and the 70 and over age group (561 hospitalisations; 7.7%; 19 hospitalisations per 100,000 people). The lowest rate of opioid-related hospitalisations was among the 10-19 age group (214 hospitalisations; 2.9%; 6.9 hospitalisations per 100,000 people).
There have been shifts in the age groups experiencing the greatest rate of opioid-related hospitalisations. In 1999-00, crude rates were highest in the 20-29 and 30-39 age groups (168 and 88 hospitalisations per 100,000 people, respectively). The rate of hospitalisations has, however, declined in these age groups over the course of monitoring. By contrast, opioid-related hospitalisations have increased among older Australians. The rate of opioid-related hospitalisations is over three times higher in 2019-20 compared to 1999-00 for the 50-59 age group (37 versus 11 hospitalisations per 100,000 people), about five times higher for the 60-69 age group (24 versus 6 hospitalisations per 100,000 people) and almost three times higher for those aged 70 and older (19 versus 7 hospitalisations per 100,000 people) (Figure 7).
Compared to 2018-19, there were significant decreases in opioid-related hospitalisation rates in the 20-29, 30-39, 40-49 and 60-69 age groups in 2019-20 (p<0.050) (Table 2).
Sex and Age
Trends in opioid-related hospitalisations for males and females by age group follow a similar pattern as described above (Figure 7).
Figure 7. Crude rate per 100,000 people of opioid-related hospitalisations among the female (A), male (B) and total (C) Australian population, by age group, 1999-00 to 2019-20.
Note: The rates for the 0-9 years age group are not presented due to sensitivity of the data.
Remoteness Area of Usual Residence
In 2019-20, the rate of opioid-related hospitalisations was highest in major cities (29 hospitalisations per 100,000 people; 5,475 hospitalisations), followed by outer regional (24 per 100,000 people; 500 hospitalisations) and inner regional Australia (24 per 100,000 people; 1,019 hospitalisations), and it was lowest in remote and very remote areas (18 per 100,000 people; 88 hospitalisations) (Figure 6).
Compared to 2018-19, the rate of opioid-related hospitalisations in 2019-20 decreased significantly in major cities (34 to 29 hospitalisations per 100,000 people; p<0.001), inner regional areas (27 to 24 per 100,000 people; p<0.001) and remote and very remote areas (22 to 18 per 100,000 people; p<0.001) (Table 15).
Principal Diagnosis
In 2019-20, nearly half (49%) of all opioid-related hospitalisations were due to opioid poisoning (3,565 hospitalisations; 14 per 100,000 people), with almost equal percentages of these poisonings determined to be intentional (43%; 1,550 hospitalisations; 6.0 per 100,000 people) or unintentional (40%; 1,426 hospitalisations; 5.4 per 100,000 people). Mental and behavioural disorder due to use of opioids accounted for the other half of the opioid-related hospitalisations, with dependence syndromes the most commonly identified principal diagnosis (65%; 2,413 hospitalisations; 9.5 per 100,000 people) (Figure 8).
See the visualisation tool for trends over time by diagnosis type, although it is important to note changes over time may partly reflect changes in coding practices.
Figure 8. Age-standardised rate per 100,000 people of opioid-related hospitalisations among the Australian population, by principal diagnosis of mental and behavioural disorder due to substance use (A) and external cause of poisoning (B), 1999-00 to 2019-20.
Note: Age-standardised rates were not calculated if the number of hospitalisations was less than or equal to 10 (please refer to our methods document for details). Suppressed data are visible as gaps in the data series.
Opioid Type
ICD-10-AM coding means that the type of opioid involved in hospitalisations is only identified where the diagnosis relates to opioid poisoning; hospitalisations coded to other diagnosis types (e.g., opioid withdrawal) do not identify the specific opioid involved (see methods document for overview of diagnosis types). In this section, we present opioid-related hospitalisations where the principal diagnosis was opioid poisoning and the opioid involved was identified (comprising 49% of all opioid-related hospitalisations in 2019-20; see section on Section ).
Natural and semi-synthetic opioids (e.g., oxycodone, morphine) were responsible for nearly half (45%) of all hospitalisations due to opioid poisoning in 2019-20. The rate of hospitalisations for natural and semi-synthetic opioids poisoning more than doubled from 1999-00 to 2017-18 (3.5 to 9.2 hospitalisations per 100,000 people, or 674 to 2,262 hospitalisations, respectively) (Figure 9). The rate then decreased and in 2019-20 reached 6.0 hospitalisations per 100,000 people, a significant decrease from 7.0 hospitalisations per 100,000 people in 2018-19 () (Table 16).
Figure 9. Age-standardised rate per 100,000 people of opioid poisoning-related hospitalisations among the Australian population, by opioid type, 1999-00 to 2019-20.
The second most commonly cited opioid in opioid poisonings in 2019-20 was heroin, comprising 26% of all opioid poisoning-related hospitalisations. The rate of hospitalisations due to heroin poisoning was highest in 1999-00 (8.7 hospitalisations per 100,000 people), decreasing 70% by 2001-02 (2.6 per 100,000 people). From 2001-02 to 2017-18, the annual rate of hospitalisations where heroin poisoning was the principal diagnosis comprised 3.5 or fewer hospitalisations per 100,000 people each year. An increase in the rate was then observed from 3.1 in 2017-18 to 4.1 per 100,000 people in 2018-19, remaining similar in 2019-20 at 3.8 per 100,000 people () (Table 16).
The third most common opioid type, responsible for 16% of hospitalisations due to opioid poisoning in 2019-20, was synthetic opioids (e.g., fentanyl, tramadol). The rate of hospitalisations where poisoning related to synthetic opioids was the principal diagnosis increased from 0.3 per 100,000 people in 1999-00 to 2.9 in 2016-17 and since then dropped, including a decline from 2.6 in 2018-19 to 2.2 per 100,000 people in 2019-20 () (Table 16).
Rates of hospitalisations for opioid poisoning were low for methadone and 'other and unspecified opioids' over the period of monitoring (<0.9 per 100,000 people), with even fewer hospitalisations related to opium (data not shown to protect confidentiality).
Opioid Type and Remoteness Area of Usual Residence
In 2019-20, natural and semi-synthetic opioids were the leading cause of hospitalisations related to opioid poisoning in all remoteness areas. The highest rate was observed in outer regional Australia ( 9.6 hospitalisations per 100,000 people), followed by inner regional Australia (6.6 hospitalisations per 100,000 people), remote and very remote areas (6.0 hospitalisations per 100,000 people) and major cities (5.4 hospitalisations per 100,000 people) (Figure 10).
The rate of heroin poisoning hospitalisations was highest in major cities (4.1 hospitalisations per 100,000 people), double the rate in inner regional Australia (1.9 hospitalisations per 100,000 people) and more than double the rate in outer regional Australia (1.6 hospitalisations per 100,000 people). Age-standardised rate and crude rate were not computed for heroin poisoning hospitalisations in remote and very remote Australia because the total number of hospitalisations was too small (n<=5).
In contrast, the rate of synthetic opioid poisoning-related hospitalisations was highest in outer regional areas (4.0 hospitalisations per 100,000 people), followed by remote and very remote (2.8 hospitalisations per 100,000 people) and inner regional areas (2.2 hospitalisations per 100,000 people), and double the rate in major cities (2.0 hospitalisations per 100,000 people).
The rates of hospitalisations due to poisoning by methadone and other and unspecified opioids were low in major cities and regional Australia (below 1.3 per 100,000 people), while in remote and very remote areas there were less than or equal to 5 hospitalisations for each of these opioid types (hence estimates are not shown) (Figure 10).
Figure 10. Age-standardised rate per 100,000 people of opioid poisoning-related hospitalisations among the Australian population, by remoteness and opioid type, 2019-20.
Note: Age-standardised rates were not shown for remote and very remote areas with some opioid types because the number of hospitalisations was less than or equal to 10. Please refer to our methods document for details.
Amphetamine and Other Stimulant-Related Hospitalisations
The following findings describe amphetamine and other stimulant-related hospitalisations. Due to the coding system used, these hospitalisations may relate to methamphetamines, 3,4-methylenedioxymethamphetamine (MDMA, 'ecstasy'), pharmaceutical stimulants such as dexamphetamine, and other stimulants (e.g., caffeine).
In 2019-20, there were 17,044 hospitalisations (70 hospitalisations per 100,000 people) with a principal diagnosis related to amphetamines and other stimulants. From 2009-10 to 2015-16, the rate increased five times (64 compared to 13 hospitalisations per 100,000 people). The rate of hospitalisations in 2017-18 was 57 per 100,000 people, which represented two consecutive years of decline relative to 2015-16 yet remained elevated compared to the rates observed from 1999-00 through to 2014-15. After an increase in 2018-19, the rate of hospitalisations increased again in 2019-20 (p<0.001) (Table 1) and reached its highest level over the period of monitoring (70 per 100,000 people).
Sex
In 2019-20, the rate of hospitalisations related to amphetamines and other stimulants in Australian males was nearly double the rate of females ( versus per 100,000 people), with % of hospitalisations occurring among males. Despite the changes in rates over time, the magnitude of the difference between males and females has remained similar. The rates of hospitalisations significantly increased for both males and females compared to 2018-19 ( and per 100,000 people, respectively; ) (Table 1).
Age
In 2019-20, hospitalisations related to amphetamines and other stimulants were most common among Australians aged 30-39 (36%; 6,099 hospitalisations; 162 per 100,000 people), followed by the 20-29 age group (31%; 5,268 hospitalisations; 146 per 100,000 people), and the 40-49 age group (21%; 3,574 hospitalisations; 108 per 100,000 people). The 20-29 age group had the highest rate of amphetamine and other stimulant-related hospitalisations prior to 2016-17, but has since been overtaken by the 30-39 age group.
Compared to 2018-19, amphetamines and other stimulant-related hospitalisation rates increased significantly in 2019-20 in the 10-19, 20-29, 30-39, 40-49 and 50-59 age groups (p<0.050) (Table 2).
Sex and Age
The changes in the age demographic described above have mostly been driven by males, with hospitalisations among females remaining largely comparable among the 20-29 and 30-39 age groups (Figure 11).
Figure 11. Crude rate per 100,000 people of amphetamine and other stimulant-related hospitalisations among the female (A), male (B) and total (C) Australian population, by age group, 1999-00 to 2019-20.
Note: Given the small numbers, the age groups 60-69 years, and 70 years and over are combined into the 60 years and over age group. Numbers for the 50-59 years, and the 60 years and over age groups in the earlier years are small and thus rates are suppressed to protect confidentiality. The rates for the 0-9 years age group are not presented due to sensitivity of the data.
Remoteness Area of Usual Residence
The highest rate of amphetamine and other stimulant hospitalisations was observed in outer regional Australia (80 hospitalisations per 100,000 people) and the lowest rate in inner regional Australia (62 hospitalisations per 100,000 people) (Figure 6). The rate of amphetamine and other stimulant related hospitalisations increased significantly in all remoteness areas of Australia compared to 2018-19, with the increase being most prominent in remote and very remote areas where rates increased from 59 hospitalisations per 100,000 people in 2018-19 to 73 hospitalisations per 100,000 people in 2019-20 (p<0.001) (Table 15).
Principal Diagnosis
Over the entire period of monitoring, amphetamine and other stimulant related hospitalisations mostly comprised a principal diagnosis of mental and behavioural disorder due to substance use (% in 2019-20). Among those who received a principal diagnosis of mental and behavioural disorder due to use of amphetamine and other stimulants in 2019-20 ( hospitalisations; per 100,000 people), psychotic disorder was the main reason for hospitalisation (%; hospitalisations; per 100,000 people), followed by dependence (%; hospitalisations; per 100,000 people) (Figure 12).
Rates of hospitalisation relating to amphetamine and other stimulant poisonings have remained low over the period of monitoring (% of amphetamine and other stimulant-related hospitalisations; hospitalisations; per 100,000 people in 2019-20). In 2019-20, two-fifths (%) of amphetamine and other stimulant related poisonings were unintentional ( hospitalisations; per 100,000 people), % were intentional ( hospitalisations; per 100,000 people) and % were of undetermined intent ( hospitalisations; per 100,000 people) (Table 13).
Please refer to the visualisation tool for trends over time by diagnosis type, although it is important to note changes over time may partly reflect changes in coding practices.
Figure 12. Age-standardised rate per 100,000 people of amphetamine and other stimulant-related hospitalisations among the Australian population, by principal diagnosis of mental and behavioural disorder due to substance use (A) and external cause of poisoning (B), 1999-00 to 2019-20.
Note: Age-standardised rates were not calculated if the number of hospitalisations was less than or equal to 10 (please refer to our methods document for details). Suppressed data are visible as gaps in the data series.
Cannabinoid-Related Hospitalisations
In 2019-20, there were 6,427 cannabinoid-related hospitalisations (including cannabis and synthetic cannabinoids), which equates to an age-standardised rate of 26 hospitalisations per 100,000 people. This is the highest rate recorded over the course of monitoring and is more than double the rate observed in 1999-00 (11 hospitalisations per 100,000 people), and an increase relative to 2018-19 (24 hospitalisations per 100,000 people; p<0.001) (Table 1).
Sex
In 2019-20, males presented to hospital with a cannabinoid-related principal diagnosis more often than females (3,873 versus 2,552 hospitalisations; 60% male). This trend has remained relatively consistent, although there have been some fluctuations over time. Specifically, after an observed decrease between 2016-17 and 2018-19 (35 per 100,000 people in 2016-17 to 33 and 29 per 100,000 people in 2017-18 and 2018-19, respectively), male hospitalisations increased again in 2019-20 (31 per 100,000 people; p<0.001). In contrast, the rate of cannabinoid-related hospitalisations among females has continuously increased, particularly from 2016-17 onwards (16 per 100,000 people in 2016-17 to 18 and 19 per 100,000 people in 2017-18 and 2018-19, respectively), reaching a peak of 21 hospitalisations per 100,000 people in 2019-20 (p<0.001) (Table 1).
Age
In 2019-20, the highest rate of cannabinoid-related hospitalisations was recorded for the 20-29 age group (75 hospitalisations per 100,000 people; 42%), followed by the 30-39 (38 hospitalisations per 100,000 people; 22%) and 10-19 (31 hospitalisations per 100,000 people; 15%) age groups (Figure 13).
All age groups have recorded an increase in cannabinoid-related hospitalisations since 1999-00, with the greatest increase observed in the 20-29 age group (36 versus 75 hospitalisations per 100,000 people in 1999-00 versus 2019-20).
Compared to 2018-19, cannabinoid-related hospitalisation rates increased significantly in 2019-20 in the 10-19 and 50-59 age groups (p=0.016 and p<0.001, respectively) (Table 2).
Figure 13. Crude rate per 100,000 people of cannabinoid-related hospitalisations among the female (A), male (B) and total (C) Australian population, by age group, 1999-00 to 2019-20.
Note: Given the small numbers, the age groups 60-69 years, and 70 years and over are combined into the 60 years and over age group. Numbers for the 50-59 years, and the 60 years and over age groups in the earlier years are small and thus rates are suppressed to protect confidentiality. The rates for the 0-9 years age group are not presented due to sensitivity of the data.
Sex and Age
In the last three years, we have observed a particular increase in the rates of cannabinoid-related hospitalisations among young females, particularly those aged 20-29 years, while the rate among males aged 20-29 has decreased. There were only small numbers of hospitalisations each year for those aged 70 years and over; thus, data for this age group are not shown to protect confidentiality (Figure 13).
Remoteness Area of Usual Residence
The highest rate of cannabinoid-related hospitalisations was observed in remote and very remote areas, with the rate increasing from 59 hospitalisations per 100,000 people in 2018-19 to 79 hospitalisations per 100,000 people in 2019-20 (p<0.001). This rate was over two times the rate in regional Australia (38 and 29 hospitalisations per 100,000 people in outer and inner regional areas, respectively) and over three times the rate in major cities (22 hospitalisations per 100,000 people) (Figure 6). Increases in rates, however, were also observed between 2018-19 and 2019-20 in inner regional Australia (25 to 29 hospitalisations per 100,000 people; p<0.001) and outer regional Australia (32 to 38 hospitalisations per 100,000 people; p<0.001) (Table 15).
Principal Diagnosis
Over the entire period of monitoring, cannabinoid-related hospitalisations mostly comprised a principal diagnosis of mental and behavioural disorder (92% in 2019-20). Among those who received a principal diagnosis of mental and behavioural disorder due to use of cannabinoids in 2019-20 (5,902 hospitalisations; 24 per 100,000 people), psychotic disorder was the main reason for hospitalisation (%; hospitalisations; per 100,000 people) followed by dependence (32%; 1,902 hospitalisations; 7.6 per 100,000 people) (Figure 14; Table 12).
Over the course of monitoring, the rate of hospitalisations due to cannabinoid poisoning has remained low (8.2% of cannabinoids-related hospitalisations in 2019-20; 525 hospitalisations; 2.1 per 100,000 people). In 2019-20, about half of the cannabinoid-related poisoning hospitalisations were unintentional (53%; 277 hospitalisations; 1.1 per 100,000 people), 35% were of undetermined intent (184 hospitalisations; 0.7 per 100,000 people) and 11% were intentional (60 hospitalisations; 0.2 per 100,000 people) (Figure 14; Table 13).
Please refer to the visualisation tool for trends over time by diagnosis type, although it is important to note changes over time may partly reflect changes in coding practices.
Figure 14. Age-standardised rate per 100,000 people of cannabinoid-related hospitalisations among the Australian population, by principal diagnosis of mental and behavioural disorder due to substance use (A) and external cause of poisoning (B), 1999-00 to 2019-20.
Note: Age-standardised rates were not calculated if the number of hospitalisations was less than or equal to 10 (please refer to our methods document for details). Suppressed data are visible as gaps in the data series.
Cocaine-Related Hospitalisations
In 2019-20, there were 5.0 cocaine-related hospitalisations per 100,000 people (1,241 hospitalisations). This was stable from 2018-19 (p=0.114) (Table 1), and represents a plateauing of the upward trend that has been observed over the course of monitoring, particularly from 2010-11 to 2018-19 (Man et al., 2021).
Sex
In 2019-20, there were 8.1 cocaine-related hospitalisations per 100,000 people among males and 1.9 hospitalisations per 100,000 people among females (1,005 versus 236 hospitalisations; 81% male). The aforementioned increase in the rate of cocaine-related hospitalisations between 2010-11 and 2018-19 has been driven mostly by an increase in hospitalisations among males (Figure 15A). Between 2018-19 and 2019-20, however, there was a significant increase in the rate of cocaine-related hospitalisations among females (1.6 to 1.9 hospitalisations per 100,000 people; p=0.004) (Table 1).
Figure 15. Age-standardised rate per 100,000 people of cocaine-related hospitalisations among the Australian population by sex (A) and crude rate per 100,000 people of cocaine-related hospitalisations among the Australian population by age group (B), 1999-00 to 2019-20.
Note: Numbers for age groups 50-59 years (before 2004-05), 60-69 and 70 years and over are small, thus rates are suppressed to protect confidentiality or data is presented for a collapsed group of 50 years and over where possible. The rates for the 0-9 years age group are not presented due to sensitivity of the data.
Age
In 2019-20, the majority of cocaine-related hospitalisations occurred among people aged 20-29 (36%) and 30-39 (33%), with particular increases in the rate of cocaine-related hospitalisations over time occurring among these two age groups (Figure 15B). However, the rate of cocaine-related hospitalisations did not show a significant change among the 30-39 age group between 2018-19 and 2019-20 (12 and 11 hospitalisations per 100,000 people, respectively; p=0.224), but continued to increase among the 20-29 age group, reaching a peak of 12 hospitalisations per 100,000 people in 2019-20 (p=0.004) (Table 2).
Compared to 2018-19, cannabinoids-related hospitalisation rates increased significantly in 2019-20 in the 20-29 and 50-59 age groups (p=0.004 and p<0.001, respectively) (Table 2).
Sex and Age
The small number of hospitalisations precludes reporting of estimates disaggregated by both age and sex.
Remoteness Area of Usual Residence
In 2019-20, the rate of cocaine-related hospitalisations was highest in major cities (6.0 hospitalisations per 100,000 people), and was three times higher than in inner regional areas (2.7 hospitalisations per 100,000 people) and six times higher than in outer regional areas (1.0 hospitalisations per 100,000 people) (Figure 6).
Inner regional areas recorded an increase in the rate of cocaine-related hospitalisations between 2018-19 and 2019-20, from 0.9 to 2.7 hospitalisations per 100,000 people (p<0.001) (Table 15).
Principal Diagnosis
Over the entire period of monitoring, cocaine-related hospitalisations mostly comprised a principal diagnosis of mental and behavioural disorder (86% in 2019-20). Among those who received a principal diagnosis of mental and behavioural disorder due to use of cocaine in 2019-20 (1,065 hospitalisations; 4.3 per 100,000 people), dependence syndrome was the main reason for hospitalisation (64%; 683 hospitalisations; 2.8 per 100,000 people), followed by psychotic disorder (%; hospitalisations; per 100,000 people) (Figure 16).
Over the course of monitoring, the rate of hospitalisations due to cocaine poisoning has remained low (14% of cocaine-related hospitalisations in 2019-20; 176 hospitalisations; 0.7 per 100,000 people). In 2019-20, half of the hospitalisations due to cocaine poisoning were unintentional (52%; 91 hospitalisations; 0.4 per 100,000 people), 26% were of undetermined intent (45 hospitalisations; 0.2 per 100,000 people) and 23% were intentional (40 hospitalisations; 0.2 per 100,000 people) (Figure 16; Table 13).
Please refer to the visualisation tool for trends over time by diagnosis type, although it is important to note changes over time may partly reflect changes in coding practices.
Figure 16. Age-standardised rate per 100,000 people of cocaine-related hospitalisations among the Australian population, by principal diagnosis of mental and behavioural disorder due to substance use (A) and external cause of poisoning (B), 1999-00 to 2019-20.
Note: Age-standardised rates were not calculated if the number of hospitalisations was less than or equal to 10 (please refer to our methods document for details). Suppressed data are visible as gaps in the data series.
Drug-Related Hospitalisations by Jurisdiction
The below sections describe trends in drug-related hospitalisations for each jurisdiction from 1999-00 to 2019-20. We encourage caution when interpreting some of these figures given the small number of hospitalisations for some drug types in less populous jurisdictions (e.g., Northern Territory, Tasmania). Data on the number and rate (crude and/or age-standardised) of hospitalisations by sex, age group and drug type for each jurisdiction can be obtained from the publicly-accessible online interactive data visualisation. Data by remoteness area are not reported for the Australian Capital Territory as over 99.8% of the population reside in major cities, and data on remoteness area for Queensland are only provided for 2018-19 and 2019-20. Data by remoteness area are available for all other jurisdictions from 2012-13 to 2019-20. The following are links to the jurisdictional reports:
- Australian Capital Territory
- New South Wales
- Northern Territory
- Queensland
- South Australia
- Tasmania
- Victoria
- Western Australia
Funding
The Drug Trends program is funded by the Australian Government Department of Health under the Drug and Alcohol Program.
Acknowledgements
We would like to acknowledge the Australian Institute of Health and Welfare for data from the National Hospital Morbidity Database.
We thank Dr Louise Tierney and her team from the Tobacco, Alcohol and Other Drugs Unit at the Australian Institute of Health and Welfare for reviewing the report.
We would like to acknowledge the contribution of those who have been involved in past reporting on drug-related hospitalisations by Drug Trends, specifically: A/Prof Timothy Dobbins, Dr Amanda Roxburgh, and A/Prof Lucinda Burns.
We acknowledge the traditional custodians of the land on which the work for this report was undertaken. We pay respect to Elders past, present, and emerging.
Recommended citation
Chrzanowska, A., Man, N., Sutherland, R., Degenhardt, L. & Peacock, A. (2021). Trends in drug-related hospitalisations in Australia, 1999-2020. Sydney: National Drug and Alcohol Research Centre, UNSW Sydney.
Related Links
Hospitalisations data visualisations: https://drugtrends.shinyapps.io/hospital_separations
Hospitalisations methods document: https://ndarc.med.unsw.edu.au/resource-analytics/trends-drug-related-hospitalisations-australia-1999-2020
For other Drug Trends publications on drug-related hospitalisations and drug-induced deaths, go to: https://ndarc.med.unsw.edu.au/project/national-illicit-drug-indicators-project-nidip
For more information on NDARC research, go to: http://ndarc.med.unsw.edu.au/
For more information about the AIHW and NHMD, go to: https://www.aihw.gov.au/
For more information on ICD coding go to: http://www.who.int/classifications/icd/en/ https://www.ihpa.gov.au/what-we-do/icd-10-am-achi-acs-current-edition
For more research from the Drug Trends program go to: https://ndarc.med.unsw.edu.au/program/drug-trends
Contact us
Email: drugtrends@unsw.edu.au
Appendix
Table 1. Age-standardised rate per 100,000 people of drug-related hospitalisations in 2019-20 and 2018-19, and rate ratio and p-value for difference between 2019-20 and 2018-19, by main drugs (all drugs; opioids; amphetamines and other stimulants; cannabinoids; and, cocaine) and sex
| Age-standardised rate (95% CI) | 2019-20 versus 2018-19 | ||||
|---|---|---|---|---|---|
| Drug | Sex | 2019-20 | 2018-19 | Rate ratio (95% CI) | P-value |
| All drugs | Female | 242 (239,245) | 243 (240,246) | 0.99 (0.98, 1.01) | 0.419 |
| All drugs | Male | 264 (261,267) | 259 (256,262) | 1.02 (1.01, 1.03) | <0.001 |
| All drugs | Total | 253 (251,255) | 251 (249,253) | 1.01 (1.00, 1.02) | 0.181 |
| Opioids | Female | 23 (23,24) | 29 (28,30) | 0.81 (0.78, 0.84) | <0.001 |
| Opioids | Male | 34 (33,35) | 38 (36,39) | 0.90 (0.87, 0.93) | <0.001 |
| Opioids | Total | 28 (28,29) | 33 (33,34) | 0.86 (0.83, 0.89) | <0.001 |
| Cannabinoids | Female | 21 (20,22) | 19 (18,20) | 1.11 (1.06, 1.16) | <0.001 |
| Cannabinoids | Male | 31 (30,32) | 29 (28,30) | 1.07 (1.03, 1.11) | <0.001 |
| Cannabinoids | Total | 26 (25,27) | 24 (23,25) | 1.08 (1.04, 1.13) | <0.001 |
| Cocaine | Female | 1.9 ( 1.7, 2.2) | 1.6 ( 1.3, 1.8) | 1.25 (1.07, 1.45) | 0.004 |
| Cocaine | Male | 8.1 ( 7.6, 8.7) | 7.8 ( 7.3, 8.3) | 1.04 (0.97, 1.12) | 0.268 |
| Cocaine | Total | 5.0 ( 4.8, 5.3) | 4.7 ( 4.4, 5.0) | 1.08 (0.98, 1.18) | 0.114 |
Note: 95% confidence intervals for the age-standardised rate and rate ratio are shown in brackets. Please refer to our methods document on 'Presentation of results' for interpretation of rate ratios. Please also refer to our methods document on 'Scope of the data' and 'Coding of hospitalisations' for specifications of data selected and all exclusions.
Table 2. Crude rate per 100,000 people of drug-related hospitalisations in 2019-20 and 2018-19, and rate ratio and p-value for difference between 2019-20 and 2018-19, by main drugs (all drugs; opioids; amphetamines and other stimulants; cannabinoids; and, cocaine) and age group
| Crude rate (95% CI) | 2019-20 versus 2018-19 | ||||
|---|---|---|---|---|---|
| Drug | Age | 2019-20 | 2018-19 | Rate ratio (95% CI) | P-value |
| All drugs | 10-19 | 251 (246,257) | 240 (234,245) | 1.05 (1.01, 1.08) | 0.005 |
| All drugs | 20-29 | 491 (484,498) | 466 (459,473) | 1.05 (1.03, 1.07) | <0.001 |
| All drugs | 30-39 | 412 (405,418) | 411 (405,418) | 1.00 (0.98, 1.02) | 0.908 |
| All drugs | 40-49 | 334 (328,340) | 344 (337,350) | 0.97 (0.95, 1.00) | 0.032 |
| All drugs | 50-59 | 180 (175,185) | 184 (179,189) | 0.98 (0.94, 1.02) | 0.250 |
| All drugs | 60-69 | 86 (83,90) | 98 (94,102) | 0.88 (0.83, 0.93) | <0.001 |
| All drugs | 70 and over | 70 (67,73) | 73 (70,77) | 0.95 (0.90, 1.01) | 0.126 |
| Opioids | 10-19 | 6.9 ( 6.0, 7.9) | 7.7 ( 6.7, 8.7) | 0.91 (0.75, 1.09) | 0.292 |
| Opioids | 20-29 | 32 (31,34) | 37 (35,39) | 0.88 (0.82, 0.95) | 0.002 |
| Opioids | 30-39 | 48 (46,50) | 56 (53,58) | 0.86 (0.81, 0.92) | <0.001 |
| Opioids | 40-49 | 51 (49,54) | 66 (64,69) | 0.77 (0.72, 0.82) | <0.001 |
| Opioids | 50-59 | 37 (35,39) | 36 (34,39) | 1.02 (0.94, 1.11) | 0.654 |
| Opioids | 60-69 | 24 (22,26) | 31 (29,33) | 0.77 (0.70, 0.85) | <0.001 |
| Opioids | 70 and over | 19 (18,21) | 20 (19,22) | 0.94 (0.84, 1.06) | 0.306 |
| Cannabinoids | 10-19 | 31 (30,34) | 28 (26,30) | 1.12 (1.02, 1.23) | 0.016 |
| Cannabinoids | 20-29 | 75 (72,77) | 71 (68,74) | 1.05 (1.00, 1.11) | 0.071 |
| Cannabinoids | 30-39 | 38 (36,40) | 36 (34,38) | 1.07 (0.99, 1.15) | 0.096 |
| Cannabinoids | 40-49 | 22 (20,23) | 20 (19,22) | 1.08 (0.97, 1.20) | 0.154 |
| Cannabinoids | 50-59 | 15 (14,16) | 12 (11,13) | 1.28 (1.11, 1.47) | <0.001 |
| Cannabinoids | 60-69 | 3.3 ( 2.7, 4.1) | 3.0 ( 2.4, 3.7) | 1.11 (0.82, 1.50) | 0.507 |
| Cannabinoids | 70 and over | 1.0 ( 0.6, 1.4) | 0.9 ( 0.6, 1.4) | 1.03 (0.60, 1.76) | 0.910 |
| Cocaine | 10-19 | 1.6 ( 1.2, 2.1) | 1.4 ( 1.0, 1.9) | 1.12 (0.75, 1.69) | 0.569 |
| Cocaine | 20-29 | 12 (11,14) | 10 (9,11) | 1.22 (1.07, 1.40) | 0.004 |
| Cocaine | 30-39 | 11 (10,12) | 12 (11,13) | 0.92 (0.80, 1.05) | 0.224 |
| Cocaine | 40-49 | 7.0 ( 6.1, 8.0) | 7.4 ( 6.5, 8.3) | 0.95 (0.80, 1.14) | 0.597 |
| Cocaine | 50-59 | 3.0 ( 2.4, 3.7) | 1.4 ( 1.0, 1.9) | 2.14 (1.49, 3.07) | <0.001 |
Note: 95% confidence intervals for the crude rate and rate ratio are shown in brackets. Please refer to our methods document on 'Presentation of results' for interpretation of rate ratios. The estimates for the 0-9 years age group are not presented due to sensitivity of the data. Please also refer to our methods document on 'Scope of the data' and 'Coding of hospitalisations' for specifications of data selected and all exclusions.
Table 3. Crude rate per 100,000 people of drug-related hospitalisations in 2019-20 and 2018-19, and rate ratio and p-value for difference between 2019-20 and 2018-19, by sex and age group
| Crude rate (95% CI) | 2019-20 versus 2018-19 | |||
|---|---|---|---|---|
| Sex, Age | 2019-20 | 2018-19 | Rate ratio (95% CI) | P-value |
| Female, 10-19 | 332 (322,341) | 330 (320,339) | 1.01 (0.97, 1.05) | 0.767 |
| Female, 20-29 | 472 (462,482) | 444 (434,453) | 1.06 (1.03, 1.10) | <0.001 |
| Female, 30-39 | 327 (319,335) | 332 (324,340) | 0.98 (0.95, 1.02) | 0.397 |
| Female, 40-49 | 289 (281,297) | 299 (290,307) | 0.97 (0.93, 1.01) | 0.099 |
| Female, 50-59 | 171 (164,177) | 185 (178,192) | 0.92 (0.88, 0.97) | 0.003 |
| Female, 60-69 | 93 (88,98) | 112 (106,118) | 0.83 (0.77, 0.89) | <0.001 |
| Female, 70 and over | 79 (74,83) | 83 (79,88) | 0.94 (0.87, 1.02) | 0.137 |
| Male, 10-19 | 175 (168,181) | 154 (148,161) | 1.13 (1.07, 1.20) | <0.001 |
| Male, 20-29 | 508 (498,519) | 488 (478,498) | 1.04 (1.01, 1.07) | 0.006 |
| Male, 30-39 | 498 (488,508) | 491 (481,502) | 1.01 (0.98, 1.04) | 0.356 |
| Male, 40-49 | 380 (371,390) | 390 (380,399) | 0.97 (0.94, 1.01) | 0.156 |
| Male, 50-59 | 189 (182,196) | 183 (176,190) | 1.04 (0.98, 1.09) | 0.182 |
| Male, 60-69 | 79 (74,84) | 83 (78,88) | 0.95 (0.87, 1.03) | 0.223 |
| Male, 70 and over | 60 (56,64) | 62 (58,66) | 0.97 (0.88, 1.07) | 0.567 |
Note: 95% confidence intervals for the crude rate and rate ratio are shown in brackets. Please refer to our methods document on 'Presentation of results' for interpretation of rate ratios. The estimates for the 0-9 years age group are not presented due to sensitivity of the data. Please also refer to our methods document on 'Scope of the data' and 'Coding of hospitalisations' for specifications of data selected and all exclusions.
Table 4. Age-standardised rate per 100,000 people of drug-related hospitalisations in 2019-20 and 2018-19, and rate ratio and p-value for difference between 2019-20 and 2018-19, by remoteness area of usual residence and by sex
| Age-standardised rate (95% CI) | 2019-20 versus 2018-19 | ||||
|---|---|---|---|---|---|
| Remoteness | Sex | 2019-20 | 2018-19 | Rate ratio (95% CI) | P-value |
| Major Cities | Female | 225 (222,229) | 227 (224, 230) | 0.99 (0.98, 1.01) | 0.258 |
| Major Cities | Male | 256 (253,259) | 250 (247, 253) | 1.02 (1.01, 1.04) | <0.001 |
| Major Cities | Total | 240 (238,243) | 238 (236, 241) | 1.01 (1.00, 1.02) | 0.201 |
| Inner Regional | Female | 246 (239,253) | 249 (242, 256) | 0.99 (0.97, 1.00) | 0.049 |
| Inner Regional | Male | 239 (232,246) | 226 (219, 232) | 1.06 (1.04, 1.07) | <0.001 |
| Inner Regional | Total | 242 (237,247) | 237 (232, 242) | 1.02 (1.01, 1.03) | 0.002 |
| Outer Regional | Female | 314 (303,326) | 315 (303, 327) | 1.00 (0.99, 1.01) | 0.901 |
| Outer Regional | Male | 277 (266,288) | 270 (259, 281) | 1.02 (1.01, 1.04) | <0.001 |
| Outer Regional | Total | 295 (287,303) | 292 (284, 300) | 1.01 (1.00, 1.02) | 0.047 |
| Remote and Very Remote | Female | 291 (268,314) | 274 (252, 296) | 1.06 (1.05, 1.07) | <0.001 |
| Remote and Very Remote | Male | 311 (289,334) | 289 (268, 312) | 1.08 (1.06, 1.09) | <0.001 |
| Remote and Very Remote | Total | 301 (285,317) | 282 (267, 297) | 1.07 (1.06, 1.08) | <0.001 |
Note: 95% confidence intervals for the age-standardised rate and rate ratio are shown in brackets. Please refer to our methods document on 'Presentation of results' for interpretation of rate ratios. Please also refer to our methods document on 'Scope of the data' and 'Coding of hospitalisations' for specifications of data selected and all exclusions.
Table 5. Crude rate per 100,000 people of drug-related hospitalisations in2019-20 and 2018-19, and rate ratio and p-value for difference compared to 2018-19, by remoteness area of usual residence and by age group
| Crude rate (95% CI) | 2019-20 versus 2018-19 | ||||
|---|---|---|---|---|---|
| Remoteness | Age | 2019-20 | 2018-19 | Rate ratio (95% CI) | P-value |
| Major Cities | 10-19 | 229 ( 223, 236) | 216 ( 210, 222) | 1.06 (1.02, 1.10) | 0.004 |
| Major Cities | 20-29 | 460 ( 452, 468) | 432 ( 424, 439) | 1.07 (1.04, 1.09) | <0.001 |
| Major Cities | 30-39 | 385 ( 378, 392) | 387 ( 380, 394) | 0.99 (0.97, 1.02) | 0.700 |
| Major Cities | 40-49 | 322 ( 315, 329) | 338 ( 331, 346) | 0.95 (0.92, 0.98) | 0.002 |
| Major Cities | 50-59 | 182 ( 177, 188) | 183 ( 177, 189) | 1.00 (0.95, 1.04) | 0.864 |
| Major Cities | 60-69 | 91 ( 87, 96) | 105 ( 100, 110) | 0.87 (0.82, 0.93) | <0.001 |
| Major Cities | 70 and over | 76 ( 72, 80) | 79 ( 75, 83) | 0.96 (0.90, 1.04) | 0.321 |
| Inner Regional | 10-19 | 266 ( 252, 279) | 253 ( 241, 267) | 1.05 (0.98, 1.13) | 0.202 |
| Inner Regional | 20-29 | 501 ( 481, 521) | 475 ( 456, 495) | 1.05 (1.00, 1.11) | 0.065 |
| Inner Regional | 30-39 | 404 ( 387, 422) | 382 ( 365, 399) | 1.06 (1.00, 1.13) | 0.070 |
| Inner Regional | 40-49 | 282 ( 268, 297) | 283 ( 269, 297) | 1.00 (0.93, 1.07) | 0.954 |
| Inner Regional | 50-59 | 144 ( 134, 154) | 166 ( 156, 177) | 0.86 (0.79, 0.95) | 0.002 |
| Inner Regional | 60-69 | 73 ( 66, 80) | 85 ( 78, 93) | 0.86 (0.75, 0.98) | 0.019 |
| Inner Regional | 70 and over | 59 ( 54, 65) | 57 ( 51, 63) | 1.04 (0.90, 1.20) | 0.558 |
| Outer Regional | 10-19 | 340 ( 318, 363) | 335 ( 313, 358) | 1.01 (0.92, 1.11) | 0.781 |
| Outer Regional | 20-29 | 582 ( 551, 614) | 596 ( 565, 628) | 0.98 (0.91, 1.05) | 0.533 |
| Outer Regional | 30-39 | 476 ( 449, 504) | 461 ( 435, 489) | 1.03 (0.95, 1.12) | 0.467 |
| Outer Regional | 40-49 | 365 ( 342, 390) | 355 ( 332, 379) | 1.03 (0.94, 1.13) | 0.524 |
| Outer Regional | 50-59 | 200 ( 184, 217) | 189 ( 173, 206) | 1.06 (0.94, 1.19) | 0.370 |
| Outer Regional | 60-69 | 83 ( 72, 94) | 83 ( 72, 95) | 1.00 (0.83, 1.20) | 0.968 |
| Outer Regional | 70 and over | 58 ( 50, 68) | 74 ( 64, 85) | 0.79 (0.64, 0.97) | 0.025 |
| Remote and Very Remote | 10-19 | 394 ( 346, 447) | 417 ( 368, 472) | 0.94 (0.79, 1.13) | 0.521 |
| Remote and Very Remote | 20-29 | 703 ( 638, 773) | 614 ( 554, 678) | 1.15 (1.00, 1.32) | 0.053 |
| Remote and Very Remote | 30-39 | 411 ( 368, 459) | 380 ( 337, 426) | 1.08 (0.92, 1.27) | 0.324 |
| Remote and Very Remote | 40-49 | 351 ( 307, 401) | 313 ( 271, 359) | 1.12 (0.93, 1.36) | 0.232 |
| Remote and Very Remote | 50-59 | 150 ( 121, 183) | 157 ( 128, 190) | 0.96 (0.72, 1.27) | 0.762 |
| Remote and Very Remote | 60-69 | 64 ( 44, 89) | 84 ( 60, 113) | 0.76 (0.48, 1.20) | 0.240 |
| Remote and Very Remote | 70 and over | 53 ( 33, 82) | 43 ( 25, 70) | 1.24 (0.65, 2.38) | 0.516 |
Note: 95% confidence intervals for the crude rate and rate ratio are shown in brackets. Please refer to our methods document on 'Presentation of results' for interpretation of rate ratios. The estimates for the 0-9 years age group are not presented due to sensitivity of the data. Please also refer to our methods document on 'Scope of the data' and 'Coding of hospitalisations' for specifications of data selected and all exclusions.
Table 6. Age-standardised rate per 100,000 people of drug-related hospitalisations in 2019-20 and rate ratio and p-value for difference compared to 2018-19, by mental and behavioural disorder due to substance use identified in the principal diagnosis, and by sex
| Age-standardised rate (95% CI) | 2019-20 versus 2018-19 | ||||
|---|---|---|---|---|---|
| Principal diagnosis | Sex | 2019-20 | 2018-19 | Rate ratio (95% CI) | P-value |
| Any mental and behavioural disorder due to substance use | Female | 100 (99,102) | 94 (93,96) | 1.06 (1.04, 1.08) | <0.001 |
| Any mental and behavioural disorder due to substance use | Male | 171 (169,173) | 167 (164,169) | 1.03 (1.01, 1.04) | <0.001 |
| Any mental and behavioural disorder due to substance use | Total | 136 (134,137) | 131 (129,132) | 1.04 (1.02, 1.06) | <0.001 |
| Acute intoxication | Female | 12 (11,12) | 9.2 ( 8.7, 9.7) | 1.29 (1.21, 1.37) | <0.001 |
| Acute intoxication | Male | 20 (19,20) | 17 (17,18) | 1.14 (1.09, 1.19) | <0.001 |
| Acute intoxication | Total | 16 (15,16) | 13 (13,14) | 1.19 (1.13, 1.25) | <0.001 |
| Harmful use | Female | 13 (12,13) | 14 (14,15) | 0.89 (0.85, 0.94) | <0.001 |
| Harmful use | Male | 21 (20,21) | 25 (25,26) | 0.81 (0.78, 0.85) | <0.001 |
| Harmful use | Total | 17 (16,17) | 20 (19,20) | 0.84 (0.80, 0.88) | <0.001 |
| Dependence | Female | 31 (30,32) | 31 (30,32) | 0.99 (0.96, 1.03) | 0.726 |
| Dependence | Male | 53 (52,54) | 51 (50,52) | 1.04 (1.01, 1.07) | 0.004 |
| Dependence | Total | 42 (41,43) | 41 (40,42) | 1.02 (0.99, 1.05) | 0.164 |
| Withdrawal | Female | 7.3 ( 6.8, 7.8) | 7.8 ( 7.3, 8.3) | 0.93 (0.87, 1.00) | 0.054 |
| Withdrawal | Male | 9.3 ( 8.7, 9.8) | 11 (10,11) | 0.87 (0.82, 0.93) | <0.001 |
| Withdrawal | Total | 8.3 ( 7.9, 8.6) | 9.2 ( 8.8, 9.6) | 0.90 (0.84, 0.96) | 0.002 |
| Psychotic disorder | Female | 36 (35,37) | 30 (29,31) | 1.19 (1.15, 1.24) | <0.001 |
| Psychotic disorder | Male | 66 (64,67) | 60 (59,61) | 1.10 (1.07, 1.12) | <0.001 |
| Psychotic disorder | Total | 51 (50,52) | 45 (44,46) | 1.13 (1.10, 1.16) | <0.001 |
| Other mental and behavioural disorder due to substance use | Female | 1.2 ( 1.0, 1.4) | 1.5 ( 1.3, 1.7) | 0.77 (0.65, 0.92) | 0.004 |
| Other mental and behavioural disorder due to substance use | Male | 2.5 ( 2.2, 2.8) | 2.2 ( 2.0, 2.5) | 1.13 (0.99, 1.29) | 0.064 |
| Other mental and behavioural disorder due to substance use | Total | 1.8 ( 1.7, 2.0) | 1.9 ( 1.7, 2.0) | 0.99 (0.85, 1.14) | 0.846 |
Note: 95% confidence intervals for the age-standardised rate and rate ratio are shown in brackets. Please refer to our methods document on 'Presentation of results' for interpretation of rate ratios. Please also refer to our methods document on 'Scope of the data' and 'Coding of hospitalisations' for specifications of data selected and all exclusions.
Table 7. Crude rate per 100,000 people of drug-related hospitalisations in 2019-20 and rate ratio and p-value for difference compared to 2018-19, by mental and behavioural disorder due to substance use identified in the principal diagnosis, and by age
| Crude rate (95% CI) | 2019-20 versus 2018-19 | ||||
|---|---|---|---|---|---|
| Principal diagnosis | Age | 2019-20 | 2018-19 | Rate ratio (95% CI) | P-value |
| Any mental and behavioural disorder due to substance use | 10-19 | 75 (72,78) | 63 (60,66) | 1.18 (1.11, 1.25) | <0.001 |
| Any mental and behavioural disorder due to substance use | 20-29 | 297 (291,302) | 277 (272,283) | 1.07 (1.04, 1.10) | <0.001 |
| Any mental and behavioural disorder due to substance use | 30-39 | 279 (274,285) | 273 (268,278) | 1.02 (1.00, 1.05) | 0.090 |
| Any mental and behavioural disorder due to substance use | 40-49 | 198 (193,203) | 198 (193,203) | 1.00 (0.97, 1.04) | 0.963 |
| Any mental and behavioural disorder due to substance use | 50-59 | 76 (73,79) | 73 (70,76) | 1.04 (0.99, 1.11) | 0.144 |
| Any mental and behavioural disorder due to substance use | 60-69 | 26 (24,28) | 32 (30,34) | 0.81 (0.73, 0.89) | <0.001 |
| Any mental and behavioural disorder due to substance use | 70 and over | 14 (12,15) | 15 (13,16) | 0.92 (0.80, 1.05) | 0.225 |
| Acute intoxication | 10-19 | 14 (12,15) | 9.8 ( 8.7, 10.9) | 1.40 (1.21, 1.63) | <0.001 |
| Acute intoxication | 20-29 | 33 (31,35) | 28 (26,30) | 1.17 (1.07, 1.27) | <0.001 |
| Acute intoxication | 30-39 | 31 (29,33) | 27 (25,29) | 1.15 (1.06, 1.25) | 0.001 |
| Acute intoxication | 40-49 | 23 (22,25) | 20 (19,22) | 1.16 (1.04, 1.28) | 0.006 |
| Acute intoxication | 50-59 | 7.0 ( 6.1, 8.0) | 5.4 ( 4.6, 6.2) | 1.31 (1.07, 1.60) | 0.010 |
| Acute intoxication | 60-69 | 1.7 ( 1.2, 2.3) | 1.5 ( 1.1, 2.1) | 1.12 (0.73, 1.71) | 0.609 |
| Acute intoxication | 70 and over | 1.4 ( 1.0, 1.9) | 1.4 ( 1.0, 1.9) | 1.03 (0.66, 1.61) | 0.884 |
| Harmful use | 10-19 | 12 (11,14) | 10 (9,11) | 1.21 (1.04, 1.40) | 0.013 |
| Harmful use | 20-29 | 38 (36,40) | 35 (33,37) | 1.08 (1.00, 1.17) | 0.046 |
| Harmful use | 30-39 | 29 (28,31) | 39 (37,41) | 0.76 (0.71, 0.83) | <0.001 |
| Harmful use | 40-49 | 25 (23,27) | 35 (33,37) | 0.71 (0.65, 0.78) | <0.001 |
| Harmful use | 50-59 | 9.0 ( 8.0, 10.1) | 17 (15,18) | 0.54 (0.47, 0.63) | <0.001 |
| Harmful use | 60-69 | 4.8 ( 4.0, 5.7) | 4.8 ( 4.0, 5.7) | 0.99 (0.78, 1.27) | 0.965 |
| Harmful use | 70 and over | 1.2 ( 0.9, 1.7) | 1.8 ( 1.3, 2.3) | 0.69 (0.45, 1.06) | 0.089 |
| Dependence | 10-19 | 11 (9,12) | 10 (9,11) | 1.03 (0.88, 1.20) | 0.700 |
| Dependence | 20-29 | 89 (86,92) | 88 (85,92) | 1.01 (0.96, 1.06) | 0.798 |
| Dependence | 30-39 | 91 (88,94) | 86 (83,89) | 1.05 (1.00, 1.11) | 0.036 |
| Dependence | 40-49 | 63 (60,65) | 65 (62,67) | 0.97 (0.91, 1.03) | 0.329 |
| Dependence | 50-59 | 32 (30,34) | 25 (23,27) | 1.28 (1.16, 1.40) | <0.001 |
| Dependence | 60-69 | 12 (10,13) | 18 (17,20) | 0.65 (0.56, 0.75) | <0.001 |
| Dependence | 70 and over | 6.0 ( 5.2, 7.0) | 5.7 ( 4.8, 6.6) | 1.07 (0.86, 1.32) | 0.558 |
| Withdrawal | 10-19 | 4.8 ( 4.0, 5.6) | 4.3 ( 3.6, 5.1) | 1.12 (0.88, 1.42) | 0.349 |
| Withdrawal | 20-29 | 14 (13,16) | 16 (15,18) | 0.88 (0.79, 0.99) | 0.040 |
| Withdrawal | 30-39 | 15 (14,17) | 18 (17,19) | 0.85 (0.76, 0.95) | 0.004 |
| Withdrawal | 40-49 | 12 (11,14) | 13 (12,15) | 0.93 (0.82, 1.07) | 0.323 |
| Withdrawal | 50-59 | 6.8 ( 5.9, 7.8) | 7.6 ( 6.7, 8.7) | 0.90 (0.74, 1.08) | 0.244 |
| Withdrawal | 60-69 | 3.6 ( 2.9, 4.4) | 4.5 ( 3.8, 5.4) | 0.79 (0.61, 1.04) | 0.088 |
| Withdrawal | 70 and over | 3.7 ( 3.1, 4.5) | 4.4 ( 3.7, 5.3) | 0.85 (0.66, 1.10) | 0.213 |
| Psychotic disorder | 10-19 | 31 (30,34) | 27 (25,29) | 1.16 (1.05, 1.27) | 0.002 |
| Psychotic disorder | 20-29 | 119 (115,122) | 105 (102,109) | 1.13 (1.08, 1.18) | <0.001 |
| Psychotic disorder | 30-39 | 110 (106,113) | 99 (96,103) | 1.10 (1.06, 1.15) | <0.001 |
| Psychotic disorder | 40-49 | 72 (69,75) | 62 (60,65) | 1.16 (1.09, 1.23) | <0.001 |
| Psychotic disorder | 50-59 | 21 (19,22) | 18 (16,19) | 1.15 (1.03, 1.29) | 0.014 |
| Psychotic disorder | 60-69 | 3.8 ( 3.1, 4.6) | 3.1 ( 2.5, 3.9) | 1.22 (0.91, 1.63) | 0.179 |
| Psychotic disorder | 70 and over | 1.0 ( 0.7, 1.4) | 1.5 ( 1.0, 2.0) | 0.68 (0.42, 1.09) | 0.108 |
Note: 95% confidence intervals for the crude rate and rate ratio are shown in brackets. Please refer to our methods document on 'Presentation of results' for interpretation of rate ratios. The estimates for other mental and behavioural disorder due to substance use identified in the principal diagnosis are not presented due to small numbers. The estimates for the 0-9 years age group are not presented due to sensitivity of the data. Please also refer to our methods document on 'Scope of the data' and 'Coding of hospitalisations' for specifications of data selected and all exclusions.
Table 8. Age-standardised rate per 100,000 people of drug-related hospitalisations in 2019-20 and rate ratio and p-value for difference compared to 2018-19, by mental and behavioural disorder due to substance use identified in the principal diagnosis, and by remoteness area
| Age-standardised rate (95% CI) | 2019-20 versus 2018-19 | ||||
|---|---|---|---|---|---|
| Principal diagnosis | Remoteness | 2019-20 | 2018-19 | Rate ratio (95% CI) | P-value |
| Acute intoxication | Major Cities | 15 ( 15, 16) | 13 ( 12, 13) | 1.21 (1.15, 1.28) | <0.001 |
| Acute intoxication | Inner Regional | 11 ( 10, 12) | 8.69 ( 7.8, 9.7) | 1.24 (1.16, 1.32) | <0.001 |
| Acute intoxication | Outer Regional | 16 ( 14, 18) | 14 ( 12, 16) | 1.12 (1.07, 1.18) | <0.001 |
| Acute intoxication | Remote and Very Remote | 17 ( 14, 22) | 16 ( 13, 21) | 1.05 (1.00, 1.10) | 0.056 |
| Any mental and behavioural disorder due to substance use | Major Cities | 132 (130,134) | 130 (128, 132) | 1.02 (1.00, 1.03) | 0.066 |
| Any mental and behavioural disorder due to substance use | Inner Regional | 114 (110,117) | 98 ( 95, 101) | 1.16 (1.13, 1.18) | <0.001 |
| Any mental and behavioural disorder due to substance use | Outer Regional | 140 (135,146) | 125 (120, 130) | 1.12 (1.10, 1.14) | <0.001 |
| Any mental and behavioural disorder due to substance use | Remote and Very Remote | 170 (158,182) | 148 (137, 160) | 1.15 (1.13, 1.16) | <0.001 |
| Dependence | Major Cities | 48 ( 47, 49) | 48 ( 47, 49) | 1.01 (0.98, 1.04) | 0.599 |
| Dependence | Inner Regional | 27 ( 25, 28) | 23 ( 21, 25) | 1.17 (1.12, 1.22) | <0.001 |
| Dependence | Outer Regional | 16 ( 14, 18) | 14 ( 12, 16) | 1.17 (1.11, 1.23) | <0.001 |
| Dependence | Remote and Very Remote | 9.18 ( 6.6, 12.4) | 14 ( 11, 18) | 0.66 (0.62, 0.70) | <0.001 |
| Harmful use | Major Cities | 16 ( 16, 17) | 21 ( 20, 21) | 0.79 (0.76, 0.83) | <0.001 |
| Harmful use | Inner Regional | 13 ( 12, 14) | 12 ( 11, 14) | 1.06 (1.00, 1.12) | 0.041 |
| Harmful use | Outer Regional | 18 ( 16, 20) | 17 ( 15, 19) | 1.06 (1.01, 1.11) | 0.017 |
| Harmful use | Remote and Very Remote | 21 ( 17, 25) | 19 ( 15, 23) | 1.09 (1.04, 1.14) | <0.001 |
| Other mental and behavioural disorder due to substance use | Major Cities | 1.58 ( 1.4, 1.8) | 1.68 ( 1.5, 1.9) | 0.94 (0.81, 1.10) | 0.455 |
| Other mental and behavioural disorder due to substance use | Inner Regional | 2.07 ( 1.6, 2.6) | 1.58 ( 1.2, 2.0) | 1.31 (1.13, 1.52) | <0.001 |
| Other mental and behavioural disorder due to substance use | Outer Regional | 2.31 ( 1.6, 3.2) | 1.94 ( 1.3, 2.7) | 1.19 (1.03, 1.36) | 0.015 |
| Other mental and behavioural disorder due to substance use | Remote and Very Remote | 3.43 ( 2.0, 5.6) | 2.33 ( 1.2, 4.2) | 1.47 (1.31, 1.66) | <0.001 |
| Psychotic disorder | Major Cities | 44 ( 43, 45) | 39 ( 38, 40) | 1.11 (1.08, 1.15) | <0.001 |
| Psychotic disorder | Inner Regional | 52 ( 50, 55) | 43 ( 41, 45) | 1.21 (1.18, 1.25) | <0.001 |
| Psychotic disorder | Outer Regional | 74 ( 70, 78) | 65 ( 62, 69) | 1.13 (1.11, 1.16) | <0.001 |
| Psychotic disorder | Remote and Very Remote | 100 ( 91,110) | 78 ( 70, 87) | 1.28 (1.26, 1.31) | <0.001 |
| Withdrawal | Major Cities | 7.15 ( 6.8, 7.5) | 8.18 ( 7.8, 8.6) | 0.87 (0.81, 0.94) | <0.001 |
| Withdrawal | Inner Regional | 8.46 ( 7.6, 9.4) | 9.44 ( 8.5, 10.5) | 0.90 (0.84, 0.96) | 0.001 |
| Withdrawal | Outer Regional | 14 ( 12, 16) | 13 ( 11, 15) | 1.10 (1.04, 1.16) | <0.001 |
| Withdrawal | Remote and Very Remote | 19 ( 15, 23) | 18 ( 15, 23) | 1.04 (0.99, 1.09) | 0.106 |
Note: 95% confidence intervals for the age-standardised rate and rate ratio are shown in brackets. Please refer to our methods document on 'Presentation of results' for interpretation of rate ratios. The estimates for other mental and behavioural disorder due to substance use identified in the principal diagnosis are not presented due to small numbers. Please also refer to our methods document on 'Scope of the data' and 'Coding of hospitalisations' for specifications of data selected and all exclusions.
Table 9. Age-standardised rate per 100,000 people of drug-related hospitalisations in 2019-20 and rate ratio and p-value for difference compared to 2018-19, by external cause of poisoning, and by sex
| Age-standardised rate (95% CI) | 2019-20 versus 2018-19 | ||||
|---|---|---|---|---|---|
| External cause | Sex | 2019-20 | 2018-19 | Rate ratio (95% CI) | P-value |
| Any drug poisoning | Female | 141 (139,143) | 149 (146,151) | 0.95 (0.94, 0.97) | <0.001 |
| Any drug poisoning | Male | 93 (91,95) | 92 (90,94) | 1.01 (0.99, 1.04) | 0.176 |
| Any drug poisoning | Total | 117 (116,118) | 120 (119,121) | 0.98 (0.96, 0.99) | 0.007 |
| Unintentional | Female | 23 (22,23) | 23 (22,24) | 0.97 (0.93, 1.02) | 0.216 |
| Unintentional | Male | 28 (27,28) | 26 (25,27) | 1.05 (1.01, 1.09) | 0.019 |
| Unintentional | Total | 25 (24,26) | 25 (24,25) | 1.01 (0.97, 1.05) | 0.541 |
| Intentional | Female | 109 (107,111) | 116 (114,118) | 0.94 (0.92, 0.96) | <0.001 |
| Intentional | Male | 53 (52,55) | 54 (53,56) | 0.98 (0.95, 1.01) | 0.165 |
| Intentional | Total | 81 (80,82) | 85 (84,86) | 0.95 (0.93, 0.97) | <0.001 |
| Undetermined | Female | 8.2 ( 7.7, 8.7) | 7.9 ( 7.5, 8.5) | 1.03 (0.96, 1.11) | 0.370 |
| Undetermined | Male | 10 (10,11) | 9.6 ( 9.1, 10.2) | 1.09 (1.02, 1.16) | 0.009 |
| Undetermined | Total | 9.3 ( 9.0, 9.7) | 8.8 ( 8.4, 9.2) | 1.06 (1.00, 1.14) | 0.069 |
Note: 95% confidence intervals for the age-standardised rate and rate ratio are shown in brackets. Please refer to our methods document on 'Presentation of results' for interpretation of rate ratios. The estimates for other external causes of drug poisoning identified in the principal diagnosis are not presented due to small numbers. Please also refer to our methods document on 'Scope of the data' and 'Coding of hospitalisations' for specifications of data selected and all exclusions.
Table 10. Crude rate per 100,000 people of drug-related hospitalisations in 2019-20 and rate ratio and p-value for difference compared to 2018-19, by external cause of poisoning, and by age
| Crude rate (95% CI) | 2019-20 versus 2018-19 | ||||
|---|---|---|---|---|---|
| External cause | Age | 2019-20 | 2018-19 | Rate ratio (95% CI) | P-value |
| Any drug poisoning | 10-19 | 177 (172,181) | 177 (172,181) | 1.00 (0.96, 1.04) | 0.974 |
| Any drug poisoning | 20-29 | 194 (189,199) | 189 (185,194) | 1.03 (0.99, 1.06) | 0.139 |
| Any drug poisoning | 30-39 | 132 (129,136) | 138 (134,142) | 0.96 (0.92, 1.00) | 0.028 |
| Any drug poisoning | 40-49 | 136 (132,140) | 146 (141,150) | 0.93 (0.89, 0.97) | <0.001 |
| Any drug poisoning | 50-59 | 103 (100,107) | 111 (107,115) | 0.93 (0.89, 0.98) | 0.006 |
| Any drug poisoning | 60-69 | 60 (57,63) | 66 (63,69) | 0.91 (0.85, 0.98) | 0.009 |
| Any drug poisoning | 70 and over | 56 (53,59) | 58 (56,61) | 0.96 (0.90, 1.03) | 0.264 |
| Unintentional | 10-19 | 16 (15,18) | 16 (15,17) | 1.02 (0.90, 1.15) | 0.800 |
| Unintentional | 20-29 | 34 (32,36) | 31 (29,33) | 1.09 (1.01, 1.19) | 0.027 |
| Unintentional | 30-39 | 29 (27,30) | 27 (25,29) | 1.06 (0.97, 1.15) | 0.188 |
| Unintentional | 40-49 | 29 (27,31) | 30 (29,32) | 0.94 (0.86, 1.03) | 0.204 |
| Unintentional | 50-59 | 23 (21,25) | 23 (22,25) | 0.98 (0.89, 1.09) | 0.741 |
| Unintentional | 60-69 | 18 (17,20) | 20 (18,21) | 0.93 (0.82, 1.05) | 0.261 |
| Unintentional | 70 and over | 25 (23,27) | 27 (25,29) | 0.93 (0.84, 1.03) | 0.153 |
| Intentional | 10-19 | 150 (146,154) | 152 (148,156) | 0.99 (0.95, 1.03) | 0.550 |
| Intentional | 20-29 | 142 (139,146) | 142 (138,146) | 1.00 (0.96, 1.04) | 0.918 |
| Intentional | 30-39 | 88 (85,91) | 95 (92,99) | 0.92 (0.88, 0.97) | <0.001 |
| Intentional | 40-49 | 91 (87,94) | 101 (97,104) | 0.90 (0.86, 0.94) | <0.001 |
| Intentional | 50-59 | 70 (67,73) | 77 (74,80) | 0.91 (0.86, 0.96) | 0.001 |
| Intentional | 60-69 | 35 (33,38) | 40 (38,42) | 0.88 (0.81, 0.97) | 0.006 |
| Intentional | 70 and over | 26 (24,28) | 26 (24,28) | 1.02 (0.92, 1.13) | 0.746 |
| Undetermined | 10-19 | 9.6 ( 8.5, 10.7) | 7.9 ( 6.9, 8.9) | 1.22 (1.03, 1.44) | 0.024 |
| Undetermined | 20-29 | 16 (14,17) | 14 (13,15) | 1.13 (1.00, 1.27) | 0.048 |
| Undetermined | 30-39 | 14 (13,15) | 14 (13,15) | 1.00 (0.88, 1.12) | 0.936 |
| Undetermined | 40-49 | 14 (13,15) | 13 (12,14) | 1.09 (0.96, 1.25) | 0.195 |
| Undetermined | 50-59 | 8.8 ( 7.8, 10.0) | 8.6 ( 7.6, 9.7) | 1.03 (0.87, 1.21) | 0.771 |
| Undetermined | 60-69 | 4.3 ( 3.5, 5.1) | 4.6 ( 3.8, 5.5) | 0.93 (0.72, 1.20) | 0.583 |
| Undetermined | 70 and over | 2.2 ( 1.7, 2.8) | 3.3 ( 2.7, 4.1) | 0.67 (0.49, 0.92) | 0.013 |
Note: 95% confidence intervals for the crude rate and rate ratio are shown in brackets. Please refer to our methods document on 'Presentation of results' for interpretation of rate ratios. The estimates for other external causes of drug poisoning identified in the principal diagnosis are not presented due to small numbers. The estimates for the 0-9 years age group are not presented due to sensitivity of the data. Please also refer to our methods document on 'Scope of the data' and 'Coding of hospitalisations' for specifications of data selected and all exclusions.
Table 11. Age-standardised rate per 100,000 people of drug-related hospitalisations in 2019-20 and rate ratio and p-value for difference compared to 2018-19, by external cause of poisoning, and by remoteness area
| Age-standardised rate (95% CI) | 2019-20 versus 2018-19 | ||||
|---|---|---|---|---|---|
| Principal diagnosis | Remoteness | 2019-20 | 2018-19 | Rate ratio (95% CI) | P-value |
| Any drug poisoning | Inner Regional | 128 (125,132) | 139 (135, 143) | 0.92 (0.91, 0.94) | <0.001 |
| Any drug poisoning | Major Cities | 108 (107,110) | 108 (107, 110) | 1.00 (0.98, 1.02) | 0.920 |
| Any drug poisoning | Outer Regional | 155 (149,160) | 167 (161, 173) | 0.93 (0.91, 0.94) | <0.001 |
| Any drug poisoning | Remote and Very Remote | 131 (121,142) | 134 (123, 144) | 0.98 (0.96, 1.00) | 0.026 |
| Intentional | Inner Regional | 95 ( 92, 98) | 107 (104, 110) | 0.89 (0.87, 0.91) | <0.001 |
| Intentional | Major Cities | 73 ( 72, 74) | 74 ( 73, 76) | 0.98 (0.96, 1.00) | 0.105 |
| Intentional | Outer Regional | 116 (111,121) | 127 (122, 133) | 0.91 (0.89, 0.93) | <0.001 |
| Intentional | Remote and Very Remote | 87 ( 78, 96) | 90 ( 81, 99) | 0.97 (0.95, 0.99) | 0.001 |
| Undetermined | Inner Regional | 9.66 ( 8.7, 10.7) | 8.11 ( 7.2, 9.1) | 1.19 (1.11, 1.27) | <0.001 |
| Undetermined | Major Cities | 9.08 ( 8.7, 9.5) | 8.36 ( 7.9, 8.8) | 1.09 (1.02, 1.16) | 0.015 |
| Undetermined | Outer Regional | 8.49 ( 7.2, 9.9) | 9.70 ( 8.3, 11.2) | 0.88 (0.82, 0.93) | <0.001 |
| Undetermined | Remote and Very Remote | 8.89 ( 6.4, 12.1) | 7.76 ( 5.5, 10.7) | 1.15 (1.07, 1.23) | <0.001 |
| Unintentional | Inner Regional | 21 ( 20, 23) | 22 ( 21, 23) | 0.97 (0.93, 1.01) | 0.114 |
| Unintentional | Major Cities | 25 ( 24, 25) | 24 ( 23, 25) | 1.02 (0.98, 1.06) | 0.365 |
| Unintentional | Outer Regional | 28 ( 26, 30) | 28 ( 25, 30) | 1.01 (0.97, 1.05) | 0.522 |
| Unintentional | Remote and Very Remote | 34 ( 29, 39) | 33 ( 28, 39) | 1.03 (0.99, 1.06) | 0.144 |
Note: 95% confidence intervals for the age-standardised rate and rate ratio are shown in brackets. Please refer to our methods document on 'Presentation of results' for interpretation of rate ratios. The estimates for other external causes of drug poisoning identified in the principal diagnosis are not presented due to small numbers. Please also refer to our methods document on 'Scope of the data' and 'Coding of hospitalisations' for specifications of data selected and all exclusions.
Table 12. Age-standardised rate per 100,000 people of drug-related hospitalisations in 2019-20 and rate ratio and p-value for difference compared to 2018-19, by main drugs (all drugs; opioids; amphetamines and other stimulants; cannabinoids; and cocaine), and mental and behavioural disorder due to substance use identified in the principal diagnosis
| Age-standardised rate (95% CI) | 2019-20 versus 2018-19 | ||||
|---|---|---|---|---|---|
| Drug | Principal diagnosis | 2019-20 | 2018-19 | Rate ratio (95% CI) | P-value |
| Opioids | Any mental and behavioural disorder due to substance use | 15 (14,15) | 18 (17,18) | 0.84 (0.80, 0.88) | <0.001 |
| Opioids | Acute intoxication | 1.3 ( 1.1, 1.4) | 1.1 ( 1.0, 1.3) | 1.10 (0.92, 1.32) | 0.296 |
| Opioids | Harmful use | 0.9 ( 0.8, 1.0) | 0.9 ( 0.8, 1.0) | 1.04 (0.85, 1.29) | 0.684 |
| Opioids | Dependence | 9.5 ( 9.1, 9.9) | 12 (11,12) | 0.80 (0.75, 0.85) | <0.001 |
| Opioids | Withdrawal | 2.3 ( 2.1, 2.5) | 2.9 ( 2.7, 3.1) | 0.82 (0.72, 0.92) | 0.001 |
| Opioids | Psychotic disorder | 0.7 ( 0.6, 0.8) | 0.7 ( 0.6, 0.8) | 1.01 (0.79, 1.28) | 0.946 |
| Cannabinoids | Any mental and behavioural disorder due to substance use | 24 (23,25) | 22 (22,23) | 1.07 (1.02, 1.11) | 0.002 |
| Cannabinoids | Acute intoxication | 1.4 ( 1.2, 1.5) | 1.1 ( 1.0, 1.3) | 1.21 (1.01, 1.45) | 0.036 |
| Cannabinoids | Harmful use | 2.8 ( 2.5, 3.0) | 2.6 ( 2.4, 2.8) | 1.05 (0.93, 1.18) | 0.445 |
| Cannabinoids | Dependence | 7.6 ( 7.3, 8.0) | 8.0 ( 7.7, 8.4) | 0.95 (0.89, 1.02) | 0.166 |
| Cannabinoids | Withdrawal | 1.7 ( 1.5, 1.9) | 1.7 ( 1.6, 1.9) | 1.00 (0.85, 1.16) | 0.950 |
| Cannabinoids | Psychotic disorder | 10 (10,11) | 8.5 ( 8.2, 8.9) | 1.19 (1.12, 1.27) | <0.001 |
| Cocaine | Any mental and behavioural disorder due to substance use | 4.3 ( 4.1, 4.6) | 4.0 ( 3.8, 4.3) | 1.08 (0.98, 1.19) | 0.122 |
| Cocaine | Acute intoxication | 0.4 ( 0.4, 0.5) | 0.4 ( 0.3, 0.5) | 1.16 (0.85, 1.59) | 0.349 |
| Cocaine | Harmful use | 0.5 ( 0.4, 0.6) | 0.7 ( 0.6, 0.8) | 0.67 (0.52, 0.87) | 0.003 |
| Cocaine | Dependence | 2.8 ( 2.6, 3.0) | 2.3 ( 2.2, 2.5) | 1.19 (1.05, 1.34) | 0.007 |
| Cocaine | Withdrawal | 0.1 ( 0.0, 0.1) | 0.0 ( 0.0, 0.1) | 1.39 (0.57, 3.37) | 0.469 |
| Cocaine | Psychotic disorder | 0.5 ( 0.5, 0.6) | 0.5 ( 0.4, 0.6) | 1.12 (0.85, 1.49) | 0.410 |
Note: 95% confidence intervals for the age-standardised rate and rate ratio are shown in brackets. Please refer to our methods document on 'Presentation of results' for interpretation of rate ratios. Data on other mental and behavioural disorder due to substance use identified in the principal diagnosis are not presented due to small numbers. Please also refer to our methods document on 'Scope of the data' and 'Coding of hospitalisations' for specifications of data selected and all exclusions.
Table 13. Age-standardised rate per 100,000 people of drug-related hospitalisations in 2019-20 and rate ratio and p-value for difference compared to 2018-19, by main drugs (all drugs; opioids; amphetamines and other stimulants; cannabinoids; and cocaine), and external cause of poisoning
| Age-standardised rate (95% CI) | 2019-20 versus 2018-19 | ||||
|---|---|---|---|---|---|
| Drug | External cause | 2019-20 | 2018-19 | Rate ratio (95% CI) | P-value |
| Opioids | Any drug poisoning | 14 (13,14) | 16 (15,16) | 0.87 (0.83, 0.92) | <0.001 |
| Opioids | Unintentional | 5.4 ( 5.1, 5.7) | 6.2 ( 5.9, 6.5) | 0.87 (0.80, 0.94) | <0.001 |
| Opioids | Intentional | 6.0 ( 5.7, 6.4) | 7.2 ( 6.8, 7.5) | 0.84 (0.78, 0.91) | <0.001 |
| Opioids | Undetermined | 2.3 ( 2.1, 2.5) | 2.3 ( 2.1, 2.5) | 0.99 (0.87, 1.13) | 0.889 |
| Cannabinoids | Any drug poisoning | 2.1 ( 1.9, 2.3) | 1.6 ( 1.5, 1.8) | 1.30 (1.13, 1.51) | <0.001 |
| Cannabinoids | Unintentional | 1.1 ( 1.0, 1.2) | 0.9 ( 0.8, 1.1) | 1.19 (0.97, 1.44) | 0.091 |
| Cannabinoids | Intentional | 0.2 ( 0.2, 0.3) | 0.2 ( 0.1, 0.3) | 1.29 (0.84, 1.98) | 0.246 |
| Cannabinoids | Undetermined | 0.7 ( 0.6, 0.9) | 0.5 ( 0.4, 0.6) | 1.52 (1.18, 1.97) | 0.001 |
| Cocaine | Any drug poisoning | 0.7 ( 0.6, 0.8) | 0.7 ( 0.6, 0.8) | 1.05 (0.83, 1.33) | 0.695 |
| Cocaine | Unintentional | 0.4 ( 0.3, 0.4) | 0.3 ( 0.2, 0.4) | 1.17 (0.83, 1.65) | 0.376 |
| Cocaine | Intentional | 0.2 ( 0.1, 0.2) | 0.1 ( 0.1, 0.2) | 1.17 (0.70, 1.95) | 0.561 |
| Cocaine | Undetermined | 0.2 ( 0.1, 0.2) | 0.2 ( 0.2, 0.3) | 0.81 (0.52, 1.27) | 0.355 |
Note: 95% confidence intervals for the age-standardised rate and rate ratio are shown in brackets. Please refer to our methods document on 'Presentation of results' for interpretation of rate ratios. The estimates for other external causes of drug poisoning identified in the principal diagnosis are not presented due to small numbers. Please also refer to our methods document on 'Scope of the data' and 'Coding of hospitalisations' for specifications of data selected and all exclusions.
| Age-standardised rate (95% CI) | 2019-20 versus 2018-19 | |||
|---|---|---|---|---|
| Drug | 2019-20 | 2018-19 | Rate ratio (95% CI) | P-value |
| Opioids | 28 (28,29) | 33 (33,34) | 0.86 (0.83, 0.89) | <0.001 |
| Amphetamines and other stimulants | 70 (69,71) | 63 (62,64) | 1.11 (1.08, 1.14) | <0.001 |
| Cannabinoids | 26 (25,27) | 24 (23,25) | 1.08 (1.04, 1.13) | <0.001 |
| Cocaine | 5.0 ( 4.8, 5.3) | 4.7 ( 4.4, 5.0) | 1.08 (0.98, 1.18) | 0.114 |
| Non-opioid analgesics | 27 (27,28) | 29 (29,30) | 0.93 (0.90, 0.97) | <0.001 |
| Antiepileptic, sedative-hypnotic and antiparkinsonism drugs | 41 (40,41) | 37 (36,37) | 1.11 (1.08, 1.15) | <0.001 |
| Antidepressants | 16 (16,17) | 17 (16,17) | 1.00 (0.95, 1.05) | 0.895 |
| Antipsychotics and neuroleptics | 16 (16,17) | 18 (17,18) | 0.92 (0.88, 0.97) | 0.001 |
| Hallucinogens | 1.7 ( 1.6, 1.9) | 1.5 ( 1.3, 1.6) | 1.18 (1.01, 1.39) | 0.037 |
| Volatile solvents | 3.1 ( 2.9, 3.4) | 3.0 ( 2.8, 3.2) | 1.05 (0.94, 1.18) | 0.369 |
| Multiple drug use | 18 (18,19) | 22 (21,22) | 0.84 (0.80, 0.88) | <0.001 |
Note: 95% confidence intervals for the age-standardised rate and rate ratio are shown in brackets. Please refer to our methods document on 'Presentation of results' for interpretation of rate ratios. Please also refer to our methods document on 'Scope of the data' and 'Coding of hospitalisations' for specifications of data selected and all exclusions.
Table 15. Age-standardised rate per 100,000 people of drug-related hospitalisations in 2019-20 and rate ratio and p-value for difference compared to 2018-19, by drug type identified in the principal diagnosis, and by remoteness area of usual residence
| Age-standardised rate (95% CI) | 2019-20 versus 2018-19 | ||||
|---|---|---|---|---|---|
| Drug | Remoteness | 2019-20 | 2018-19 | Rate ratio (95% CI) | P-value |
| All drugs | Major Cities | 240 (238,243) | 238 (236, 241) | 1.01 (1.00, 1.02) | 0.201 |
| All drugs | Inner Regional | 242 (237,247) | 237 (232, 242) | 1.02 (1.01, 1.03) | 0.002 |
| All drugs | Outer Regional | 295 (287,303) | 292 (284, 300) | 1.01 (1.00, 1.02) | 0.047 |
| All drugs | Remote and Very Remote | 301 (285,317) | 282 (267, 297) | 1.07 (1.06, 1.08) | <0.001 |
| Opioids | Major Cities | 29 ( 28, 30) | 34 ( 33, 35) | 0.85 (0.82, 0.88) | <0.001 |
| Opioids | Inner Regional | 24 ( 22, 25) | 27 ( 25, 28) | 0.89 (0.86, 0.93) | <0.001 |
| Opioids | Outer Regional | 24 ( 22, 27) | 25 ( 22, 27) | 0.99 (0.95, 1.03) | 0.751 |
| Opioids | Remote and Very Remote | 18 ( 15, 23) | 22 ( 18, 27) | 0.83 (0.80, 0.87) | <0.001 |
| Amphetamines and other stimulants | Major Cities | 65 ( 64, 66) | 59 ( 58, 60) | 1.11 (1.08, 1.14) | <0.001 |
| Amphetamines and other stimulants | Inner Regional | 62 ( 60, 65) | 53 ( 51, 56) | 1.16 (1.13, 1.20) | <0.001 |
| Amphetamines and other stimulants | Outer Regional | 80 ( 76, 84) | 70 ( 66, 74) | 1.14 (1.11, 1.16) | <0.001 |
| Amphetamines and other stimulants | Remote and Very Remote | 73 ( 65, 81) | 59 ( 52, 67) | 1.23 (1.20, 1.26) | <0.001 |
| Cannabinoids | Major Cities | 22 ( 22, 23) | 21 ( 21, 22) | 1.04 (1.00, 1.08) | 0.073 |
| Cannabinoids | Inner Regional | 29 ( 27, 31) | 25 ( 23, 27) | 1.16 (1.12, 1.21) | <0.001 |
| Cannabinoids | Outer Regional | 38 ( 35, 41) | 32 ( 30, 35) | 1.19 (1.15, 1.23) | <0.001 |
| Cannabinoids | Remote and Very Remote | 79 ( 71, 88) | 59 ( 52, 66) | 1.35 (1.31, 1.38) | <0.001 |
| Cocaine | Major Cities | 5.98 ( 5.6, 6.3) | 5.78 ( 5.4, 6.1) | 1.03 (0.95, 1.12) | 0.424 |
| Cocaine | Inner Regional | 2.67 ( 2.2, 3.3) | 0.91 ( 0.6, 1.3) | 2.93 (2.47, 3.47) | <0.001 |
| Cocaine | Outer Regional | 1.01 ( 0.6, 1.6) | 0.87 ( 0.5, 1.4) | 1.16 (0.94, 1.43) | 0.155 |
| Non-opioid analgesics | Major Cities | 24 ( 23, 25) | 26 ( 25, 27) | 0.93 (0.89, 0.97) | <0.001 |
| Non-opioid analgesics | Inner Regional | 32 ( 30, 34) | 34 ( 32, 35) | 0.95 (0.92, 0.99) | 0.008 |
| Non-opioid analgesics | Outer Regional | 42 ( 39, 45) | 43 ( 40, 47) | 0.96 (0.93, 0.99) | 0.012 |
| Non-opioid analgesics | Remote and Very Remote | 40 ( 34, 46) | 47 ( 41, 54) | 0.85 (0.83, 0.88) | <0.001 |
| Antiepileptic, sedative-hypnotic and antiparkinsonism drugs | Major Cities | 42 ( 41, 43) | 36 ( 35, 37) | 1.16 (1.13, 1.20) | <0.001 |
| Antiepileptic, sedative-hypnotic and antiparkinsonism drugs | Inner Regional | 33 ( 32, 35) | 35 ( 33, 37) | 0.95 (0.92, 0.98) | 0.002 |
| Antiepileptic, sedative-hypnotic and antiparkinsonism drugs | Outer Regional | 36 ( 34, 39) | 39 ( 36, 42) | 0.94 (0.91, 0.97) | <0.001 |
| Antiepileptic, sedative-hypnotic and antiparkinsonism drugs | Remote and Very Remote | 22 ( 18, 26) | 22 ( 18, 27) | 0.97 (0.93, 1.01) | 0.177 |
| Antidepressants | Major Cities | 14 ( 13, 15) | 13 ( 13, 14) | 1.05 (0.99, 1.11) | 0.078 |
| Antidepressants | Inner Regional | 21 ( 20, 23) | 23 ( 22, 25) | 0.92 (0.89, 0.96) | <0.001 |
| Antidepressants | Outer Regional | 28 ( 25, 30) | 32 ( 29, 35) | 0.87 (0.83, 0.90) | <0.001 |
| Antidepressants | Remote and Very Remote | 22 ( 18, 26) | 21 ( 17, 25) | 1.05 (1.00, 1.09) | 0.031 |
| Antipsychotics and neuroleptics | Major Cities | 15 ( 14, 15) | 16 ( 15, 16) | 0.95 (0.90, 1.00) | 0.041 |
| Antipsychotics and neuroleptics | Inner Regional | 19 ( 18, 21) | 23 ( 21, 25) | 0.85 (0.81, 0.88) | <0.001 |
| Antipsychotics and neuroleptics | Outer Regional | 23 ( 20, 25) | 25 ( 23, 27) | 0.91 (0.87, 0.94) | <0.001 |
| Antipsychotics and neuroleptics | Remote and Very Remote | 19 ( 15, 23) | 17 ( 13, 21) | 1.12 (1.07, 1.17) | <0.001 |
| Hallucinogens | Major Cities | 1.82 ( 1.6, 2.0) | 1.48 ( 1.3, 1.7) | 1.23 (1.05, 1.44) | 0.009 |
| Hallucinogens | Inner Regional | 1.54 ( 1.2, 2.0) | 0.73 ( 0.5, 1.1) | 2.11 (1.73, 2.57) | <0.001 |
| Hallucinogens | Outer Regional | 1.02 ( 0.6, 1.6) | 1.94 ( 1.3, 2.7) | 0.53 (0.44, 0.63) | <0.001 |
| Volatile solvents | Major Cities | 2.55 ( 2.3, 2.8) | 2.33 ( 2.1, 2.6) | 1.10 (0.97, 1.25) | 0.150 |
| Volatile solvents | Inner Regional | 3.60 ( 3.0, 4.2) | 3.08 ( 2.6, 3.7) | 1.17 (1.05, 1.30) | 0.006 |
| Volatile solvents | Outer Regional | 5.30 ( 4.3, 6.4) | 5.05 ( 4.1, 6.2) | 1.05 (0.96, 1.14) | 0.293 |
| Volatile solvents | Remote and Very Remote | 11 ( 9, 15) | 18 ( 14, 22) | 0.64 (0.61, 0.68) | <0.001 |
| Multiple drug use | Major Cities | 18 ( 18, 19) | 23 ( 22, 24) | 0.80 (0.76, 0.83) | <0.001 |
| Multiple drug use | Inner Regional | 13 ( 12, 14) | 13 ( 12, 14) | 1.03 (0.98, 1.09) | 0.232 |
| Multiple drug use | Outer Regional | 17 ( 15, 19) | 18 ( 16, 20) | 0.96 (0.92, 1.01) | 0.096 |
| Multiple drug use | Remote and Very Remote | 15 ( 12, 19) | 13 ( 10, 17) | 1.15 (1.09, 1.21) | <0.001 |
Note: 95% confidence intervals for the age-standardised rate and rate ratio are shown in brackets. Please refer to our methods document on 'Presentation of results' for interpretation of rate ratios. Please also refer to our methods document on 'Scope of the data' and 'Coding of hospitalisations' for specifications of data selected and all exclusions.
Table 16. Age-standardised rate per 100,000 people of opioid poisoning-related hospitalisations in 2019-20 and rate ratio and p-value for difference compared to 2018-19, by opioid type identified in the principal diagnosis
| Age-standardised rate (95% CI) | 2019-20 versus 2018-19 | |||
|---|---|---|---|---|
| Drug | 2019-20 | 2018-19 | Rate ratio (95% CI) | P-value |
| Natural and semi-synthetic opioids | 6.0 ( 5.8, 6.4) | 7.0 ( 6.7, 7.3) | 0.87 (0.80, 0.94) | <0.001 |
| Heroin | 3.8 ( 3.5, 4.0) | 4.1 ( 3.8, 4.3) | 0.93 (0.84, 1.03) | 0.175 |
| Synthetic opioids | 2.2 ( 2.0, 2.4) | 2.6 ( 2.4, 2.8) | 0.85 (0.75, 0.96) | 0.012 |
| Methadone | 1.0 ( 0.8, 1.1) | 1.1 ( 0.9, 1.2) | 0.90 (0.74, 1.10) | 0.291 |
| Other and unspecified opioids | 0.8 ( 0.7, 0.9) | 1.0 ( 0.9, 1.1) | 0.75 (0.61, 0.93) | 0.008 |
Note: 95% confidence intervals for the age-standardised rate and rate ratio are shown in brackets. Please refer to our methods document on 'Presentation of results' for interpretation of rate ratios. Please also refer to our methods document on 'Scope of the data' and 'Coding of hospitalisations' for specifications of data selected and all exclusions.