EXECUTIVE SUMMARY
In responding to illicit drugs, Australian governments expend resources in providing proactive responses, such as drug treatment or policing of drug-crimes. Governments also expend considerable resources on the indirect consequences of drug use, such as emergency department admissions for overdose, or crimes that are committed to obtain income to purchase drugs. This second category of indirect or reactive spending is generally known as the social cost approach. International experts have emphasised that drug budgets should concentrate on the direct, proactive spending by governments, and this approach is taken here.
This study provides a new estimate of Australian governments’ direct or proactive spending on illicit drug policy for 2009/10. Four drug policy domains were examined: prevention, treatment, harm reduction and law enforcement. Federal and state/territory expenditure estimates were derived for each of the four domains. A top-down approach was adopted wherever possible and consistency in method across the four domains was of central concern.
The results reveal that Australian governments spent approximately $1.7 billion in 2009/10 on illicit drugs. This included programs to prevent or delay the commencement of drug use in young people, drug treatment services including counselling and pharmacotherapy maintenance, harm reduction programs such as the needle syringe program, police detection and arrest in relation to drug crimes and policing the borders of Australia for illegal importation of drugs and their precursors.
The $1.7 billion amount equates to 0.13% of GDP, and 0.8% of all government spending. In 2009/10 it represented per person spending of $76.28.
The relative allocations to the four policy domains were as follows:
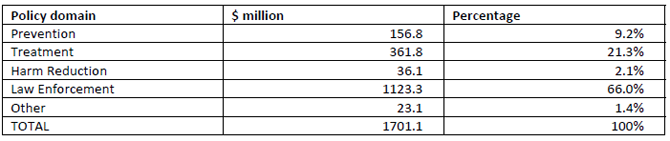
As can be seen, the majority of direct government spending was in law enforcement, representing 66% of government expenditures. This was followed by drug treatment at 21%; and then prevention at 9%. A small proportion of spending occurred for harm reduction (2%).
The state/territory governments expend a far greater proportion of the $1.7 billion than the federal government. The state/territory government spending represented 69% of the total.
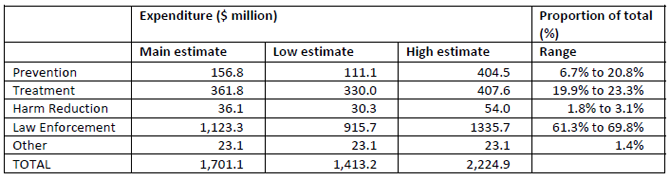
Due to lack of available data and uncertainty around the main estimates, sensitivity analyses were conducted. These reveal the plausible ranges of the relative contributions, as shown below. Thus, the prevention spending may represent between 7% and 21% of the total direct or proactive spending; law enforcement may represent between 61% and 69% of the total expenditure. For the treatment and harm reduction estimates, the sensitivity analyses reveal smaller intervals. Treatment may represent between 20% and 23%; harm reduction between 2% and 3%.
It is challenging to compare countries, largely because there are substantial methodological differences in approaches to drug budgets, and the year (and currency) vary. However, relative to other nations, the Australian drug budget results show that Australia’s spend at 0.13% of GDP is very similar to most other countries. The proportion of GDP varies between a low of 0.1% (Luxemburg and France) to a high of 0.5% in the Netherlands.
Many European nations (with the exception of France) expend the largest proportion on law enforcement. The proportion spent on law enforcement ranged from 75% of drug budget in the Netherlands, to 47% in France. For the USA, only federal spending was available, but it is noted that in 2012, the budget for law enforcement represented 60%. Drug treatment is the next largest expenditure item for every European country, consistent with the Australian findings. Australia proportionally spends the greatest amount on prevention, compared to other nations. The inclusion of non-health government spending through the school-based drug education prevention estimate for Australia is likely to account for these cross-country differences.
The first Australian drug budget was undertaken for 2002/03 (Moore, 2005). Notably the original work included both direct (proactive) and indirect (reactive) estimates. For 2009/10, a more consistent methodology was used across domains, and only proactive expenditure was included. A comparison of the two proactive estimates, given CPI adjustments to the 2002/03 figures and accommodating an important methodological difference in the prevention calculation is shown below.
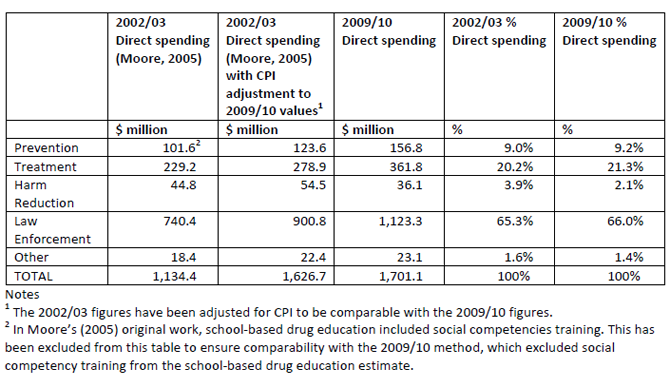
These data suggests that there has been little change in the relative balance of spending across the four policy domains in Australia between 2002/03 and 2009/10. The relative allocations are exceptionally similar (see last two columns).
Overall spending has increased by a small amount. There is a notable exception though – harm reduction is the only domain where spending has decreased. This is of concern, especially given the solid evidence-base for the effectiveness of harm reduction interventions.
As with any study such as this, there are important limitations and caveats associated with the findings. This study does not provide advice about what the ideal spending proportions should be – it is descriptive alone, providing an estimate of what governments spend in the four policy domains. These expenditure items are not matched to outputs or outcomes – this is an area for further research. The major limitation of top-down costing is that it assumes that everything in the denominator is equal. This is a significant assumption, but one which is unavoidable in this work. A number of assumptions needed to be made throughout this study, and have been documented herein. This should enable transparency in the results and the possibility for other research teams to develop contrasting estimates with alternate assumptions. Local government was not included. This study estimated government costs alone, and perforce did not include private costs.
Illicit drugs cause significant health, social and economic burdens on Australian society. Australian governments’ investment in this area represents a tiny component of all government spending (0.8%). The extent to which the policy mix of spending across domains identified here represents efficient spending cannot be ascertained from this study; new research examining the relative cost-efficiencies for each of the four policy domains is now required.