KEY FINDINGS
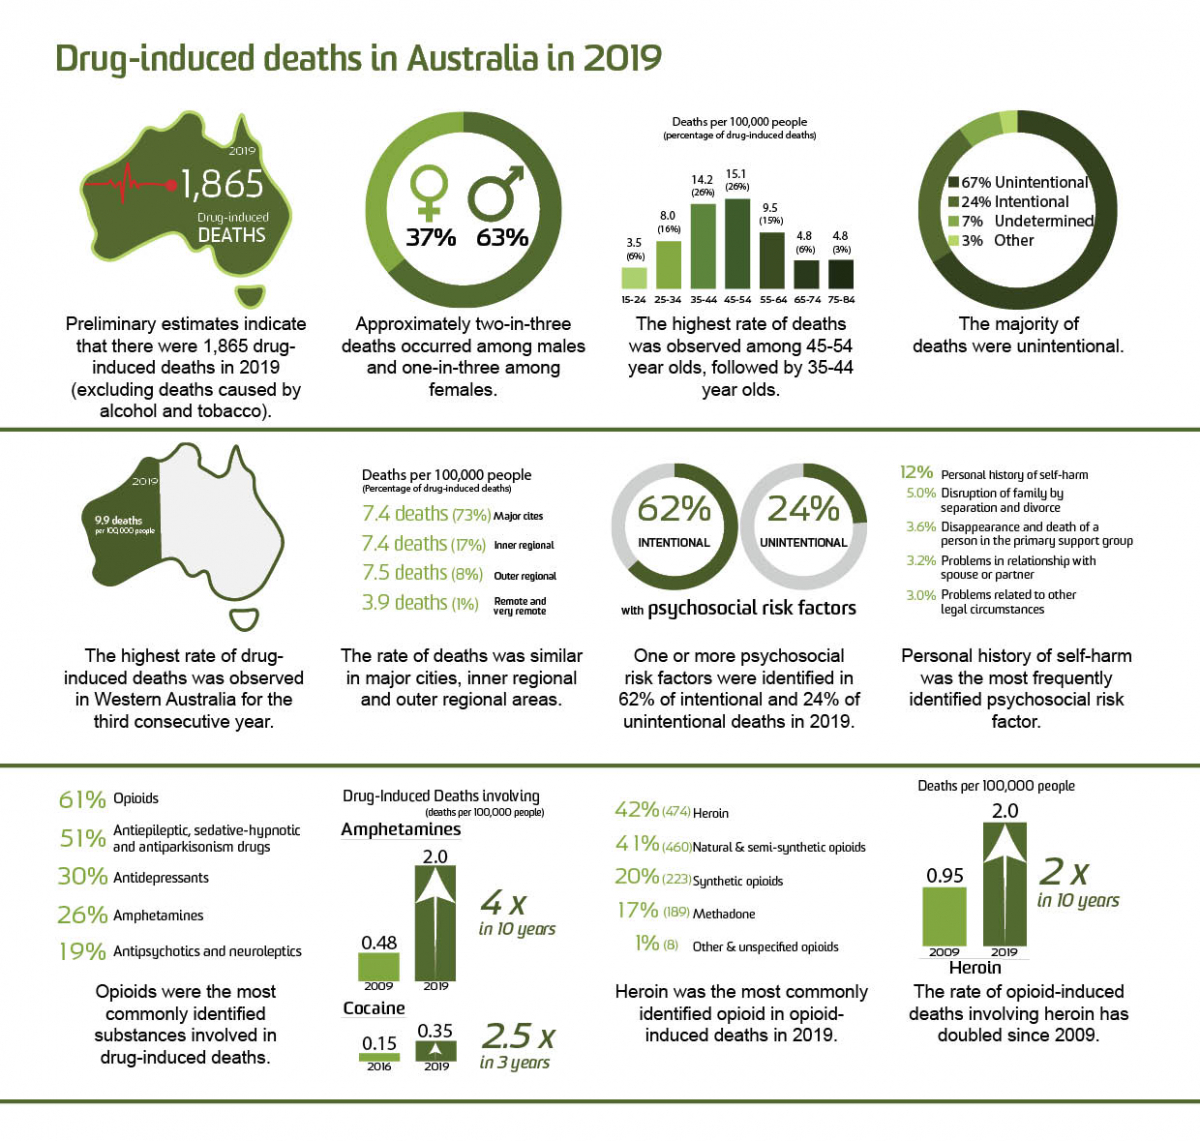
- Preliminary estimates indicate that there were 1,865 drug-induced deaths among Australians in 2019. This is equivalent to over five drug-induced deaths per day. This is the fifth year in a row where the number of deaths is higher than the earlier peak in the late 1990s.
- The preliminary rate of drug-induced deaths in 2019 was 7.4 deaths per 100,000 people. The rate has been increasing since 2006 yet remains lower than the peak rate observed in 1999 and consistent with the preliminary estimated rate in 2018.
- In 2019, one-in-four drug-induced deaths were considered intentional.
- Consistent with previous years, the rate of drug-induced deaths observed among males was nearly twice the rate observed among females in 2019.
- Those in the 45-54 and 35-44 age groups had the highest rate of drug-induced deaths in 2019; this contrasts with the late 1990s where the rate was highest in the 25-34 age group.
- The highest rate of drug-induced deaths was observed in Western Australia across all jurisdictions for the third consecutive year.
- The rate of drug-induced deaths was similar in major cities, inner regional and outer regional areas, with the lowest rate recorded in remote/very remote areas.
- At least one psychosocial risk factor for mortality (e.g., employment, housing, social and family support) was identified for one-in-four unintentional deaths and three-in-five intentional drug-induced deaths in 2019.
- Personal history of self-harm was the most frequent psychosocial risk factor identified in unintentional and intentional drug-induced deaths.
- A decrease in the rate of drug-induced deaths involving most drug types was observed from 2018 to 2019, noting that estimates are preliminary for these years. The exceptions comprised an increase in the rate of drug-induced deaths involving amphetamine and cocaine from 2018 to 2019.
- Opioids have been the main drug cited in drug-induced deaths for over two decades. They were identified as the underlying cause of 1,121 deaths in 2019 (including 873 deaths deemed unintentional).
- The rate of drug-induced deaths involving amphetamine in 2019 was four times the rate recorded in 2009.
- The rate of drug-induced deaths involving cocaine has more than doubled from 2016 to 2019.
- From 1997 to 2018, natural and semi-synthetic opioids (e.g., morphine, oxycodone) were the most commonly identified opioid in opioid-induced deaths. By contrast, heroin was the most commonly identified opioid in 2019.
BACKGROUND
This bulletin reports on all drug-induced deaths (i.e., deaths directly attributable to drug use) in Australia from 1997 to 2019. Data from the Australian Bureau of Statistics (ABS) were accessed from the Cause of Death Unit Record File (COD URF) though the Australian Coordinating Registry (ACR) and analysed in consultation with the ABS. The ABS undertake a revision process for coroner-certified deaths over a 3-year period; accordingly, data for 2017, 2018 and 2019 are not final. Full details of the methods are available for download; this document and the ABS Explanatory Notes should be read alongside this bulletin.
We provide estimates of drug-induced deaths (e.g., overdose) directly attributable to use of illicit drugs (e.g., heroin), some prescription medicines (that may be prescribed to the individual or obtained via other means) and medicines available over-the-counter. These figures only include deaths where drugs have been deemed the underlying cause of death (see Panel A). The figures presented here do not include deaths from accidents caused by being under the influence of a drug (e.g., motor vehicle accident). We have not included deaths where conditions related to alcohol or tobacco use comprise the underlying cause of death as they fall outside the scope of our monitoring. We acknowledge the significant loss of life from these substances (see the National Alcohol Indicators Project, ABS reporting and Australian Institute of Health and Welfare reporting for further information).
When we disaggregate estimates by drug type, we report on:
- drug-induced deaths by drug type, where the drug of interest may appear as the underlying and/or an associated cause of death, and
- opioid-induced deaths (i.e., where opioids are the underlying cause of death.
The codes applied here to identify cause of death have limited specificity by drug type. It is important to note that many drug-induced deaths involve more than one drug (including alcohol), and sometimes it is not possible to determine one substance as the underlying cause of death.
Estimates presented here comprise number of deaths and age-standardised mortality rates for Australians of all ages. The exception is where we report by age group (e.g., 15-64 years or in 10-year age groups); in these instances, we present age-specific rates calculated as population crude rates in the given age group. Small numbers and rates of deaths are not presented to protect the confidentiality of individuals.
We align our coding practices with those of the ABS and international organisations. Number of deaths may differ between organisations reporting on deaths due to the codes used. See our methods document for full details of the codes used for this reporting.
Panel A. Terminology
|
We have discussed selected trends of interest in the panels (Panel B: trends in drug-induced deaths involving stimulants; Panel C: trends in opioid-induced deaths involving heroin). An accompanying public online data visualisation allows viewers to disaggregate data in many different ways, and to download these images for their own use. This visualisation allows viewers to look at trends by drug, jurisdiction, sex, age group, remoteness and intent.
FINDINGS
Trends in Drug-Induced Deaths among Australians
In 2019, there were 1,865 drug-induced deaths among Australians. This equates to 7.4 deaths per 100,00 Australians. The estimated number and rate of drug-indued deaths in 2018 and 2019 are similar (1,817 versus 1,865 deaths or 7.3 deaths versus 7.4 deaths per 100,000 people, respectively), although estimates are preliminary and may be subject to revision.
There was a peak in drug-induced deaths in the late 1990s, followed by a decline in the early-mid 2000s (Figure 1). Since 2006, drug-induced deaths in Australia have increased. The number of deaths recorded each year from 2015-2019 has been higher than the number observed during the earlier peak in deaths in the late 1990s. By contrast, the rate of drug-induced deaths (adjusting for age and changes in population size) was also high in 2019 but has not reached the level observed in the late 1990s (9.1 versus 7.4 deaths per 100,000 people in 1999 versus 2019).
Figure 1. Number and age-standardised rate (per 100,000 people) of drug-induced deaths for the Australian population, 1997-2019. Deaths where conditions related to alcohol or tobacco comprised the underlying cause of death are not captured here. Causes of death data for 2017, 2018 and 2019 are not final and thus are subject to further revision. The symbol 'o' indicates revised estimates and 'x' preliminary estimates.
Intent of Drug-Induced Deaths
In 2019, 67% of drug-induced deaths were considered unintentional and 24% were considered intentional (1,244 versus 442 deaths, respectively). The rate of unintentional drug-induced deaths among Australians has been consistently higher than that of intentional deaths over time (5.0 deaths versus 1.7 per 100,000 people in 2019; Figure 2). Undetermined and other intents comprise the remaining 11% of drug-induced deaths in 2019.
Figure 2. Age-standardised rate (per 100,000 people) of drug-induced deaths for the Australian population, by intent, 1997-2019. Deaths where conditions related to alcohol or tobacco comprised the underlying cause of death are not captured here. Causes of death data for 2017, 2018 and 2019 are not final and thus are subject to further revision. The symbol 'o' indicates revised estimates and 'x' preliminary estimates.
Sex and Age Profile of Drug-Induced Deaths
By Sex
In 2019, men comprised a greater percentage of drug-induced deaths relative to women (63% versus 37%), with 1,184 drug-induced deaths among males and 681 deaths among females (9.7 deaths versus 5.2 deaths per 100,000 people). This distribution has been relatively consistent over time.
Approximately three-in-four (73%) deaths among males were unintentional in 2019 (18% intentional, 9% undetermined/other intent), while unintentional deaths accounted for over half (56%) of drug-induced deaths among females (33% intentional, 11% undetermined/other intent). This is also consistent with historical data.
By Age
In 2019, drug-induced deaths were most common among those aged 45-54 (15.1 deaths per 100,000 people) and 35-44 (14.2 per 100,000 people), and least common amongst those aged 15-24 years (3.5 deaths per 100,000 people). This represents a shift over time (Figure 3).
In the late 1990s, deaths were driven by those in the younger age groups (i.e., 25-34 age group, followed by 35-44 age group). The rate of drug-induced deaths among the 25-34 age group has since declined. By contrast, the greatest increase over time has been in the 45-54 age group (5.6 versus 15.1 deaths per 100,000 people in 1997 and 2019, respectively). Indeed, the 45-54 age group overtook all other age groups in the number and rate of drug-induced deaths in 2019.
Another large increase has occurred in the 55-64 age group (3.2 to 9.5 deaths per 100,000 people in 1997 and 2019, respectively).
Although the mortality rate remained lowest for people aged 15-24 years since 2005, a recent increase in the rate of death for this age group has also been observed (2.7 and 3.5 deaths per 100,000 people in 2018 and 2019, respectively).
In 2019, the rate of unintentional drug-induced deaths was much higher among those middle-aged (e.g., 35-44 and 45-54 age groups) relative to younger and older age groups. By contrast, rates of intentional deaths were higher among older age groups (e.g., 55+ age groups), although the difference in rates between the age groups was less as compared to unintentional deaths.
Figure 3. Crude rate (per 100,000 people) of drug-induced deaths for the Australian population, by age group, 1997-2019. Deaths where conditions related to alcohol or tobacco comprised the underlying cause of death are not captured here. Causes of death data for 2017, 2018 and 2019 are not final and subject to further revision. The symbol 'o' indicates revised estimates and 'x' preliminary estimates.
By Age and Sex
There has been a shift to higher rates of drug-induced death among males in older age groups, with highest rates observed among males aged 45-54 (19.9 deaths per 100,000 people in 2019) and 35-44 (19.5 deaths per 100,000 people in 2019), whilst in earlier years the rate was highest among the 25-34 age group (Figure 4). Rates among females have shown a similar shift, noting that the rate of drug-induced deaths among females in 2019 was highest among the 45-54 age group (10.5 deaths per 100,000 people), followed by the 35-44 (9.1 deaths per 100,000 people) and 55-64 (8.8 deaths per 100,000 people) age groups.
The aforementioned increase in rate of drug-induced deaths between 2018 and 2019 for the youngest age group (15-24 years) has been driven by males (3.5 versus 5.1 death per 100,000 people respectively); in females, the preliminary estimated rate remains low and stable (1.9 deaths per 100,000 people in 2018 and 2019).
Figure 4. Crude rate (per 100,000 people) of drug-induced deaths for the Australian population of females and males, by age group, 1997-2019. Causes of death data for 2017, 2018 and 2019 are not final and thus are subject to further revision. The symbol 'o' indicates revised estimates and 'x' preliminary estimates.
Jurisdiction and Remoteness Area of Usual Residence
By Jurisdiction
In 2019, the largest number of deaths among adults was reported in New South Wales (541 deaths), followed by Victoria (493 deaths), and Queensland (360 deaths). The rate of drug-induced deaths ranged between 6.3 and 9.9 deaths per 100,000 people per jurisdiction (excluding Northern Territory where estimates are suppressed to protect confidentiality with small numbers). The highest rate was observed in Western Australia.
By Remoteness
The greater proportion of drug-induced deaths in 2019 occurred in major cities (73%, 1,355 deaths), followed by inner regional (17%, 315 deaths), outer regional (7.8%, 145 deaths), and remote/very remote (1.0%, 19 deaths) areas. However, the age-standardised rate of drug-induced deaths in 2019 was similar in major cities, inner regional and outer regional areas (7.4, 7.4, and 7.5 deaths per 100,000 people, respectively), and lowest in remote/very remote areas (3.9 deaths per 100,000 people) (Figure 5).
Figure 5. Age-standardised rate (per 100,000 people) of drug-induced deaths for the Australian population, by remoteness area, 2009-2019. Deaths where conditions related to alcohol or tobacco comprised the underlying cause of death are not captured here. Causes of death data for 2017, 2018 and 2019 are not final and subject to further revision. The symbol 'o' indicates revised estimates and 'x' preliminary estimates. Information on statistical geography and remoteness coding can be found in the methods document of this bulletin.
By Jurisdiction and Remoteness
There are important jurisdictional differences in drug-induced deaths for major city versus regional/remote areas. For example, the rate of drug-induced deaths has been higher in regional/remote areas relative to major cities in New South Wales, although these rates converged in 2019 based on preliminary data. Victoria has seen a similar pattern. By contrast, the historical rate of drug-induced deaths has been higher in major city areas in South Australia, although rates also converged in 2019 based on preliminary data. Please see the online interactive data visualisation for further jurisdictional findings by age, sex, intent and drug.
Psychosocial Risk Factor Profile of Drug-Induced Deaths
Psychosocial factors such as employment, housing, social and family support are not collected systematically on death certificates in Australia but might be important contributors to health outcomes and mortality patterns (CSDH 2008, Psychosocial risk factors for suicide). As such, psychosocial risk factors identified in coronial, police and pathology reports on coroner-certified drug-induced deaths were coded and added to the 2017, 2018 and 2019 COD URF datasets by ABS. Interpretation of these data should be treated with caution (see ABS notes and our methods for further discussion of caveats to these data). In particular, it should be noted that drug-induced deaths are likely to have various risk factors for mortality (generally no one risk will ultimately cause death) and that risk factors could only be identified based on information available in the aforementioned reports.
One-third (33%) of deaths in 2019 had at least one psychosocial risk factor coded (39% in 2017 and 36% in 2018).
Figure 6. Percentage of drug-induced deaths with identified psychosocial risk factor, by intent and number of risk factors, Australia, 2017-2019. Deaths where conditions related to alcohol or tobacco comprised the underlying cause of death are not captured here. Causes of death data for 2017, 2018 and 2019 are not final and subject to further revision.
The most frequently identified psychosocial risk factor was personal history of self-harm (12% in 2019) (Figure 7). Other frequently identified psychosocial factors in 2019 were disruption of family by separation and divorce (5.0%), disappearance and death of a person in the primary support group (3.6%), problems in relationship with spouse or partner (3.2%), problems related to other legal circumstances (3.0%), problems related to release from prison (2.7%) and limitation of activities due to disability (2.3%).
Figure 7. Most frequently occurring psychosocial risk factors in drug-induced deaths, by intent, Australia, 2017-2019. The percentage axis has been reduced to improve presentation of the results. Causes of death data for 2017, 2018 and 2019 are not final and subject to further revision. Small numbers are suppressed.
By Intent
The presence of one or more risk factors was more commonly identified in intentional than unintentional deaths (62% versus 24% in 2019; Figure 6). Personal history of self-harm was identified more frequently in intentional relative to unintentional deaths (28% and 6.4% in 2019, respectively; Figure 7). Problems related to release from prison was more common in unintentional versus intentional deaths (e.g., 3.7% versus 1.1% in 2019), while limitation of activities due to disability was less common (e.g., 0.5% versus 7.9% in 2019). There was less differentiation in the distribution of other psychosocial risk factors between unintentional and intentional deaths.
By Sex
Psychosocial risk factors were more commonly identified among females than males (35% versus 32% in 2019; Figure 8).
Whilst personal history of self-harm was more commonly identified among females than among males, it was the leading risk factor identified for both sexes (16% versus 10% in 2019). Disappearance and death of a person in the primary support group was the second most common risk factor identified for female decedents (4.4% in 2019). By contrast, the second most common risk factor for male decedents was disruption of family by separation and divorce (6.0% in 2019).
Figure 8. Most frequently occurring psychosocial risk factors in drug-induced deaths, by sex, Australia, 2017-2019. The percentage axis has been reduced to improve presentation of the results. Causes of death data for 2017, 2018 and 2019 are not final and subject to further revision.
By Age
The percentage of drug-induced deaths where one or more psychosocial risk factor was identified was relatively equally distributed by age groups in 2019 (between 30% and 37%) (Table 1).
Table 1 Percentages of drug-induced deaths with one or more psychosocial risk factor by age group, Australia, 2017-2019. Causes of death data for 2017, 2018 and 2019 are not final and subject to further revision.
|
Age group |
Percentage |
||
|
2017 |
2018 |
2019 |
|
|
15-24 |
44 |
36 |
37 |
|
25-34 |
38 |
42 |
34 |
|
35-44 |
38 |
30 |
35 |
|
45-54 |
34 |
35 |
31 |
|
55-64 |
37 |
37 |
31 |
|
65-74 |
52 |
43 |
30 |
|
75-84 |
46 |
53 |
35 |
|
85+ |
49 |
36 |
32 |
For the most part, personal history of self-harm was the most common risk factor identified across deaths occurring in the 15-24, 35-34, 35-44, 45-54, 55-64 and 65-74 age groups in 2019. For people 75 years or older, limitation of activities due to disability was the main risk factor identified (20% in 2019).
Drug-Induced Deaths by Drug Involvement
The following findings relate to drugs identified in toxicology reports as being present in the person’s system and deemed to be contributory to that death. There may be multiple drugs that contribute to a drug-induced death.
In 2019, the most common class of drug involved in drug-induced deaths among Australians was opioids (1,137 deaths, 4.6 deaths per 100,000 people; Figure 9). This was followed by antiepileptic, sedative-hypnotic and anti-parkinsonism drugs (944 deaths, 3.8 deaths per 100,00 people), which predominantly comprised benzodiazepines (811 deaths, 3.3 deaths per 100,00 people).
Other cited drug classes included antidepressants (568 deaths, 2.2 deaths per 100,000 people), amphetamines (478 deaths, 2.0 deaths per 100,000 people), antipsychotics and neuroleptics (356 deaths, 1.5 deaths per 100,000 people), alcohol (310 deaths, 1.2 deaths per 100,000 people), non-opioid analgesics, antipyretics and antirheumatics (299 deaths, 1.2 deaths per 100,000 people) and cannabinoids (207 deaths, 0.87 deaths per 100,000 people). These observations are largely consistent when examining only unintentional deaths in 2019.
The rates for all drug classes have increased since the mid-to-late 2000s to around 2016, and from then the rates have mostly declined (noting that estimates from 2017 onwards are not finalised, and will be only revised upwards). The exceptions comprise drug-induced deaths involving amphetamines and cocaine which, despite being preliminary, demonstrated an increase from 2018 to 2019 (1.8 versus 2.0 deaths per 100,000 people for amphetamines, respectively; 0.25 versus 0.35 deaths per 100,000 people for cocaine, respectively; see Panel B for a discussion of deaths involving stimulants in the context of trends observed in other data sources).
Figure 9. Age-standardised rate (per 100,000 people) of drug-induced deaths for the Australian population, by drug class, 1997-2019. Causes of death data for 2017, 2018 and 2019 are not final and subject to further revision. The symbol 'o' indicates revised estimates and 'x' preliminary estimates. One drug-induced death may involve multiple drugs and the findings here reflect the number of drug-induced deaths involving each drug (not necessarily attributed primarily to that drug).
Panel B. Trends in drug-induced deaths involving stimulants in AustraliaEstimates from the United Nations Office on Drugs and Crime suggest that the prevalence of amphetamine and cocaine use in Australia is amongst the highest globally. Significant expansion of these markets internationally has caused concern regarding potential impacts in Australia. This concern is particularly prominent for methamphetamine, with escalating problems related to methamphetamine and claims of an ‘ice epidemic’ in Australia from approximately 2013.
Study of national data sources on cocaine and methamphetamine use, markets and harms reinforce claims of significant shifts in these indicators in recent years. For example, our analyses synthesising findings from various data sources showed increased availability and prevalence of use of cocaine since approximately 2015-2016. Whilst frequency of use has remained low, potentially related to high street price, rates of cocaine-related hospitalisations and treatment episodes have increased in recent years in Australia.
Similarly, our analyses have shown increases in indicators of problematic methamphetamine use and related harms from 2010-2012 onwards in Australia. There has been significant public attention and investment in responses to the methamphetamine ‘epidemic’ since 2015. Study of various sources suggest continued demand and a sustained market for methamphetamine and sustained high rates of population-level harms since 2015.
In both pieces of work, we analysed drug-induced deaths involving the drug of interest until 2018. These analyses suggested a gradual increase in the rate of drug-induced deaths involving cocaine from 2003-2018. By contrast, the rate of drug-induced deaths involving amphetamine was shown to have plateaued from 2016 onwards; this arose after observing an increase in the rate from 2003 to 2012, with a steeper increase observed from 2013-2015 subsequently.
In both instances, data on deaths were only available until 2018, and data for 2016-2018 were not finalised, meaning that trends in recent years had to be treated with caution. Findings presented in the current bulletin up until 2019 suggest that this caution was warranted.
CocaineUpdated estimates show that the rate of drug-induced deaths involving cocaine have continued to rise in 2019 (Figure 9). Particular increase was observed in the last three years, with the preliminary rate in 2019 (0.35 deaths per 100,000 people) being 2.5 times higher than the rate in 2016 (0.15 deaths per 100,000 people). Absolute numbers remain small relative to other drugs such as amphetamine (preliminary estimate of 86 drug-induced deaths involving cocaine in 2019 compared to 34 in 2016).
AmphetamineIn contrast with earlier analyses, updated data suggest that the rates of drug-induced deaths involving amphetamine have increased in recent years. Whilst there was a slight decline in the preliminary estimated rate in 2018 (1.8 deaths per 100,000 people) relative to 2017 (1.9 deaths per 100,000 people), the rate of drug-induced deaths involving amphetamine in 2019 (preliminary estimate of 2.0 deaths per 100,000 people) is tracking to be higher than that recorded in 2017 and all earlier years of monitoring (see Figure 9). Although drug-induced deaths involving amphetamine might arise from a range of stimulants (e.g., methamphetamine, MDMA, dexamphetamine), composition of the amphetamine-type stimulant market in Australia and previous analysis of amphetamine deaths gives confidence that most of these cases relate to methamphetamine.
These trends will require close monitoring given the potential for a greater health burden from these substances in Australia. Indeed, these findings reinforce the importance of substantial investment to develop more effective treatment options and maximise treatment access and coverage for cocaine and methamphetamine dependence.
In the absence of available effective pharmacotherapies for stimulant dependence, information and education on harm reduction strategies (e.g., avoiding rapid-onset routes of administration, reducing quantity/frequency of use) is also important to reduce risk of acute toxicity and chronic harms from these substances. |
Drug-induced deaths involving amphetamine
There were 478 drug-induced deaths involving amphetamine among Australians in 2019 (2.0 deaths per 100,000 people). The rate increased substantially from 2011 (107 deaths, 0.50 deaths per 100,000 people) to 2017 (453 deaths, 1.9 deaths per 100,000 people) and, in 2019, was the highest rate observed over the course of monitoring (Figure 9). We can expect a further increase in the rates reported for 2017-2019 when data are revised and finalised.
Highest rates of drug-induced deaths involving amphetamine were among 25-34 and 35-44 age groups for a decade (between 2005 and 2015) and continued to be highest in the 35-44 age group till 2019 (4.7 deaths per 100,000 people, 159 deaths). However, a recent increase had been observed in rate of deaths among the 45-54 age group, from 0.91 deaths per 100,000 people (28 deaths) in 2013 to 4.4 deaths per 100,000 people (141 deaths) in 2019. Indeed, this age group now has the second highest rate of amphetamine-involved deaths (Figure 10).
Figure 10. Crude rate (per 100,000 people) of drug-induced deaths involving amphetamine for the Australian population, by age, 1997-2019. Causes of death data for 2017, 2018 and 2019 are not final and subject to further revision. The symbol 'o' indicates revised estimates and 'x' preliminary estimates. Rates for small numbers are suppressed.
Opioid-Induced Deaths
The following findings relate to ‘opioid-induced deaths’; that is, those directly attributable to use of opioids (e.g., from opioid overdose). In 2019, there were 1,121 opioid-induced deaths among Australians (4.5 deaths per 100,000 people). This is compared to 1,249, 1,357 and 1,148 opioid-induced deaths in 2016, 2017 and 2018 (5.3, 5.6, and 4.7 deaths per 100,000 people), respectively, whilst noting that these numbers (except 2016) are subject to revision and anticipated to increase as coronial cases are closed.
By Intent
The majority (78%, 873 deaths) of opioid-induced deaths in 2019 were considered unintentional; 16% (174 deaths) were intentional, and a minority (6%, 66 deaths) of undetermined intent. This pattern has been relatively consistent in recent years.
By Sex
The rate of opioid-induced deaths has been consistently higher among males than females over time. In 2019, there were 6.2 versus 2.9 deaths per 100,000 people (749 versus 372 deaths) occurring among males and females, respectively.
By Age
In 2019, the rate of opioid-induced deaths was highest for Australians aged 45-54 years (9.7 deaths per 100,000 people, 313 deaths), however, the greatest number of deaths was observed in the 35-44 age group (322 deaths, 9.5 deaths per 100,000 people). Consistent with earlier years, the lowest rates were observed among Australians younger than 25 years (2.1 deaths per 100,000 people, 69 deaths) and older than 65 years (1.9 and 1.5 deaths per 100,000 people in the 65-74 and 75-84 age group, respectively, equivalent to 44 and 18 deaths) (Figure 11).
Figure 11. Crude rate (per 100,000 people) of opioid-induced deaths for the Australian population, by age, 1997-2019. Causes of death data for 2017, 2018 and 2019 are not final and subject to further revision. The symbol 'o' indicates revised estimates and 'x' preliminary estimates. Rates for small numbers are suppressed.
By Opioid Type
In 2019, 56% (632 deaths) of opioid-induced deaths were attributed to pharmaceutical opioids only, 32% (356 deaths) to illicit opioids (i.e., heroin and opium) only, and 11% (118 deaths) to both pharmaceutical opioids and illicit opioids. The remaining 0.6% (7 deaths) were attributed to other and unspecified opioids. This represents an increase in the percentage of deaths attributed to illicit opioids only since 2014 when 17% of opioid-induced deaths involved illicit opioids only, 75% pharmaceutical opioids only, 4.7% both illicit and pharmaceutical opioids, and 2.9% other and unspecified opioids. The vast majority of opioid-induced deaths involving illicit opioids involve heroin (more than 99.5% in 2019).
In 2019, there were 474 opioid-induced deaths involving heroin, 460 deaths involving natural and semi-synthetic opioids (e.g., morphine, codeine, and oxycodone), 223 deaths involving synthetic opioid opioids (e.g., fentanyl tramadol, pethidine), and 189 deaths involving methadone (these numbers are not additive as multiple opioids may be involved in a single death). This is the first year in which the number of opioid-induced deaths involving heroin has surpassed that of natural and semi-synthetic opioids (e.g., morphine, oxycodone).
Preliminary estimates suggest the rate of opioid-induced deaths involving heroin has been relatively stable in the last three years (1.9, 1.9, and 2.0 in 2017, 2018 and 2019, respectively), but there is potential for further increase with revision of estimates (Figure 12; see Panel C for further information on deaths involving heroin). By contrast, preliminary estimates suggest a decrease in opioid-induced deaths involving natural and semi-synthetic opioids (e.g., morphine, oxycodone; 2.6, 2.0, and 1.8 deaths per 100,000 people in 2017, 2018 and 2019, respectively) and to synthetic opioids (e.g., fentanyl: 1.2, 1.0, and 0.9 deaths per 100,000 people in 2017, 2018 and 2019, respectively).
Findings by opioid type should be treated with caution, particularly for earlier years where coding practices meant that deaths involving heroin may have been at greater risk of being misclassified as involving morphine.
Figure 12. Age-standardised rate (per 100,000 people) of opioid-induced deaths for all intents by heroin, methadone, natural and semi-synthetic opioids (e.g., morphine, oxycodone), opium, synthetic opioids (e.g., fentanyl, tramadol) and other opioids for the Australian population, 1997-2019. Causes of death data for 2017, 2018 and 2019 are not final and subject to further revision. The symbol 'o' indicates revised estimates and 'x' preliminary estimates. One opioid-induced death may involve multiple opioids types and that findings here reflect the number of opioid-induced deaths involving each opioid type (not necessarily attributed primarily to that opioid). Rates for small numbers are suppressed.
By Other Drug Involvement
Benzodiazepines and antidepressants remained the most common drugs involved in opioid-induced deaths for the last twenty years, with benzodiazepines being involved in 55% (614 deaths) and antidepressants in 32% (357 deaths) of opioid-induced deaths in 2019. Other drugs involved in opioid-induced deaths in 2019 were amphetamines (25%, 281 deaths), antipsychotics and neuroleptics (20%, 227 deaths), alcohol (18%, 206 deaths), 4-aminophenol derivatives (17%, 186 deaths), and antiepileptic and sedative-hypnotic drugs, unspecified (predominantly comprising pregabalin; 15%, 166 deaths) (Figure 13). These percentages are likely to be underestimates as some substances are not always included in routine toxicological screening at death.
Figure 13. Age-standardised rate (per 100,000 people) of opioid-induced deaths for the Australian population, by other drugs involved, 1997-2019. Causes of death data for 2017, 2018 and 2019 are not final and subject to further revision. The symbol 'o' indicates revised estimates and 'x' preliminary estimates. One opioid-induced death may involve multiple drugs and that findings here reflect the number of opioid-induced deaths involving each drug type. Rates for small numbers are suppressed.
Panel C. Trends in opioid-induced deaths involving heroin in AustraliaThe rate of opioid-induced deaths involving heroin in 2019 (2.0 per 100,000 people) was:
These findings are notable given that:
For the first time, opioid-induced deaths involving heroin (474 deaths) were also more common than those involving natural and semi-synthetic opioids (e.g., morphine, oxycodone and codeine; 460 deaths) in 2019, although the absolute difference in number is small.
It is important to consider these findings alongside other sources of information on heroin markets, use and harms in Australia. Analysis of seizure and arrest data suggests that the Australian heroin market remains stable. Further, our analyses of drug listings on cryptomarkets suggest no significant shift in the number of heroin listings in recent years internationally. Wastewater analyses show that estimated population-weighted average consumption of heroin in Australia increased from 2017 to 2020 (no national data available prior to 2017). Our research with sentinel samples of Australians who inject drugs recruited from capital cities does not show marked changes in patterns of heroin consumption in recent years. Similarly, our analyses of drug-related hospitalisations in Australia do not suggest increases in heroin-related hospitalisations.
These national-level findings need to be treated with some caution given differences in heroin markets and use across jurisdictions and by remoteness, with use typically higher in more populous areas. For that reason, there may be particular local trends of concern (e.g., recent work has shown increasing ambulance attendances related to heroin in Victoria).
This trend will require close ongoing monitoring, particularly given emerging evidence regarding the impact of the COVID-19 pandemic and associated restrictions on the heroin market in 2020 and beyond. Analysis of wastewater data collected until August 2020 suggested the COVID-19 pandemic and associated restrictions had no tangible negative impact on the heroin market. Data collected from people who regularly inject drugs suggest that some reported a reduction in their use in the months following COVID-19 and introduction of social restrictions. The majority who commented also noted an increase in price and decrease in purity following implementation of restrictions. Analysis of data on drug-induced deaths arising in 2020 will be important to assess short and longer-term impacts of COVID-19 and associated restrictions on drug-related harms.
Overall, these results reinforce the necessity of a continued focus on harm reduction efforts related to heroin use. Effective interventions to reduce overdose risk from heroin are key to such efforts, including:
|
Funding
The Drug Trends program is funded by the Australian Government Department of Health under the Drug and Alcohol Program.
Acknowledgements
We wish to acknowledge Lauren Moran and the team at the Australian Bureau of Statistics for their assistance with the data and ICD-10 coding practices to ensure rigorous, comprehensive, and consistent reporting on drug-induced deaths in Australia.
We also wish to acknowledge Ben Williams and the team at the Australian Coordinating Registry for providing the data. We acknowledge jurisdictional Registries of Births, Deaths and Marriages, the Coroners and the National Coronial Information System (NCIS) as the data custodians of the COD URF.
We would also like to acknowledge the contribution of those who have involved in past reporting on drug-induced deaths by Drug Trends, specifically: A/Prof Timothy Dobbins, Dr Amanda Roxburgh, and A/Prof Lucinda Burns.
Recommended citation:
Chrzanowska, A., Man, N., Sutherland, R., Degenhardt, L., & Peacock, A. (2021). Trends in drug-induced deaths in Australia, 1997-2019. Drug Trends Bulletin Series. Sydney: National Drug and Alcohol Research Centre, UNSW Sydney.
Related Links:
- Data visualisations: https://drugtrends.shinyapps.io/Deaths_2019
- Methods document: https://ndarc.med.unsw.edu.au/resource-analytics/trends-drug-induced-deaths-australia-1997-2019
- For more information on NDARC research, go to: http://ndarc.med.unsw.edu.au/
- For more information about the ABS, go to: http://www.abs.gov.au
- For more information on ICD coding go to: http://www.who.int/classifications/icd/en/
- For more information on the Remoteness Areas Structure within the Australian Statistical Geography Standard (ASGS), go to: https://www.abs.gov.au/ausstats/abs@.nsf/mf/1270.0.55.005
- For more research from the Drug Trends program and to subscribe to our newsletter go to: https://ndarc.med.unsw.edu.au/program/drug-trends
- For details on the collection, organisation and interpretation of NCIS data go to https://www.ncis.org.au/about-the-data/explanatory-notes/
- For statistics about case closure and document attachment go to https://www.ncis.org.au/about-the-data/operational-statistics/
Contact us
Email: drugtrends@unsw.edu.au