ISBN 978-0-7334-3989-6
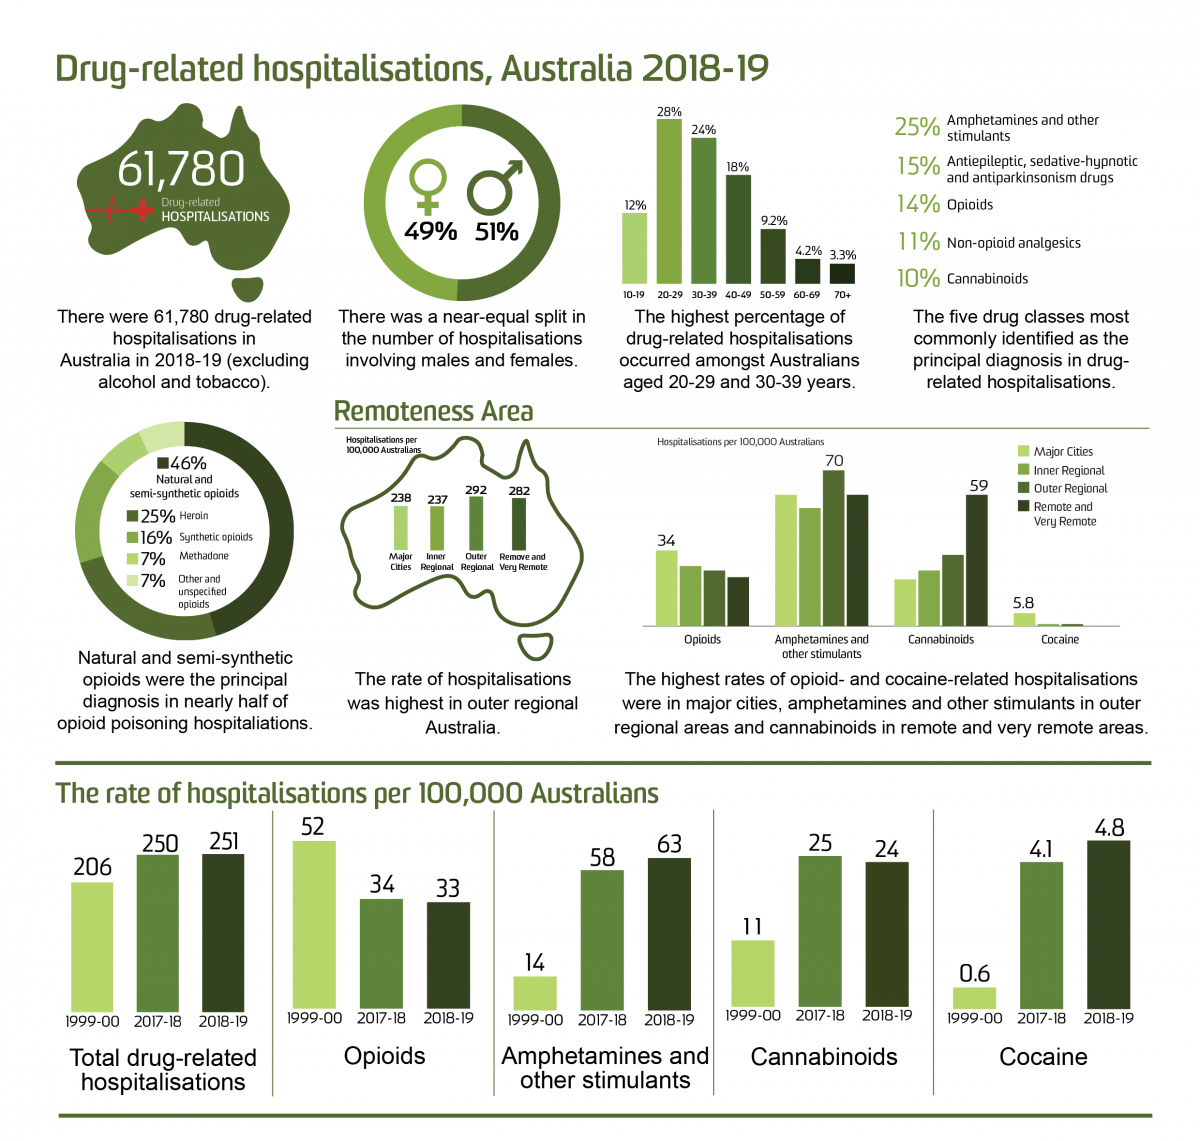
Table of Contents
- Key Findings
- Background
- Findings
- Trends in Drug-Related Hospitalisations among Australians
- Sex and Age Profile of Drug-Related Hospitalisations
- Drug-Related Hospitalisations by Drug
- Opioid-Related Hospitalisations
- Amphetamine and Other Stimulant-Related Hospitalisations
- Cannabinoid-Related Hospitalisations
- Cocaine-Related Hospitalisations
- Drug-Related Hospitalisations by Jurisdiction
- Funding
- Acknowledgements
- Recommended citation
- Related Links
- Contact us
Key Findings
-
There were 61,780 drug-related hospitalisations among Australians in 2018-19, equivalent to 0.54% of all hospitalisations in Australia.
-
The age-standardised rate of drug-related hospitalisations was relatively stable between 1999-00 and 2009-10. It subsequently increased from 199 hospitalisations per 100,000 people in 2010-11 to 272 in 2015-16 and 2016-17, before declining to 250 in 2017-18. This rate remained stable in 2018-19 (251 hospitalisations per 100,000 people).
-
In 2018-19, males accounted for 51% of drug-related hospitalisations. This is a reversal of findings up until 2014-15 where drug-related hospitalisations more commonly involved females than males.
-
In 2018-19, the highest rates of drug-related hospitalisations were observed among the 20-29 and the 30-39 age groups. The greatest increase has been observed in males aged 40-49 and 50-59, with rates of drug-related hospitalisations over two times higher in 2018-19 than in 1999-00.
-
In 2018-19, the majority of drug-related hospitalisations were among people residing in major cities (73% of hospitalisations where remoteness was coded), although the age-standardised rate of drug-related hospitalisations was highest in outer regional areas of Australia (292 hospitalisations per 100,000 people).
-
In 2018-19, the largest proportion of drug-related hospitalisations was attributable to amphetamines and other stimulants (63 hospitalisations per 100,000 people, 25% of drug-related hospitalisations), followed by antiepileptic, sedative-hypnotic and antiparkinsonism drugs (e.g., benzodiazepines; 15%), opioids (14%), non-opioid analgesics (e.g., paracetamol, 11%), and cannabinoids ( 9.6%).
-
Compared with the previous year, 2018-19 saw a significant decrease in rates of hospitalisations related to non-opioid analgesics (rate ratio=0.91; p<0.001), cannabinoids (rate ratio=0.94; p<0.001) and antiepileptic, sedative-hypnotic and antiparkinsonism drugs (rate ratio=0.95; p<0.001), while there was a significant increase in hospitalisation rates related to amphetamines and other stimulants (rate ratio=1.09; p<0.001), multiple drug use (rate ratio=1.16; p<0.001) and cocaine (rate ratio=1.33; p<0.001).
-
In 2018-19, natural and semi-synthetic opioids (e.g., oxycodone, morphine) were responsible for nearly half (46%) of all hospitalisations due to opioid poisoning. The rate of hospitalisations involving natural and semi-synthetic opioids doubled from 1999-00 to 2018-19 (3.5 to 7.0 hospitalisations per 100,000 people, respectively).
-
From 1999-00 to 2018-19, cannabinoid-related hospitalisations increased from 11 to 24 per 100,000 people. Psychostimulant-related hospitalisations also increased in that period, with cocaine-related hospitalisations increasing from 0.6 to 4.7 and amphetamines and other stimulants from 14 to 63 hospitalisations per 100,000 people. Opioid-related hospitalisations decreased from the peak of 52 hospitalisations per 100,000 people in 1999-00 to 33 hospitalisations per 100,000 people in 2018-19.
-
Major cities had the highest rate of opioid-related (34 per 100,000 people) and cocaine-related (5.8 per 100,000 people) hospitalisations compared to other remoteness areas, while outer regional areas had the highest rate of hospitalisations related to amphetamines and other stimulants (70 hospitalisations per 100,000 people) and remote and very remote areas had the highest rate of cannabinoid-related hospitalisations (59 per 100,000 people).
-
Important differences in age-standardised rate of drug-related hospitalisations by sex, age group, remoteness and drug type for each jurisdiction are discussed, and also available in our publicly-accessible online interactive visualisation.
Background
This bulletin reports on drug-related hospitalisations (see Panel A for definition) in Australia from 1999-00 to 2018-19, with a particular focus on opioid-, amphetamine and other stimulant-, cannabinoid-, and cocaine-related hospitalisations as per the aims of the Drug Trends program of work. Data were extracted from the National Hospital Morbidity Database held by the Australian Institute of Health and Welfare (AIHW). Full details of methods are available for download and should be read alongside this bulletin.
Panel A. Terminology
|
At the time of hospital separation, a principal diagnosis and up to 99 additional diagnoses may be recorded using diagnosis codes from the International Statistical Classification of Diseases and Related Health Problems, Tenth Revision, Australian Modification (ICD-10-AM). Data presented here describe hospital separations only where the principal diagnosis was directly attributable to use of illicit drugs (e.g., heroin), prescription medicines (e.g., antidepressants) or medicines available without a prescription (e.g., paracetamol). The data presented will be an underestimate of the total number of hospitalisations related to drug use, excluding those presentations where drugs are coded as an additional diagnosis and not capturing hospitalisations where drugs contributed to the presentation but were not identified in diagnosis coding.
We have not included hospitalisations where the principal diagnosis was related to tobacco or alcohol use as they fall outside the scope of our monitoring. We acknowledge the significant harm arising from these substances, and encourage readers to refer to the National Alcohol Indicators Project and AIHW reporting for information regarding alcohol- and tobacco-related hospitalisations. It is important to note that many drug-related hospitalisations involve more than one drug (including alcohol) but may have one substance coded as the 'principal diagnosis'. Further, sometimes it is not possible to determine one substance as the primary drug leading to hospitalisation; these cases are coded and presented as 'multiple drug use' and thus will not be represented in the count of hospitalisations for a single substance.
We present findings for Australians of all ages unless otherwise indicated. State of hospitalisation equals the state of usual residence as cross border separations were not provided. Hospitalisations with a care type of 'newborn' (without qualified days), and records for 'hospital boarders' and 'posthumous organ procurement' were not provided to the authors. For Tasmania, provision of data between 2008-09 and 2015-16 was limited to drug related hospital separations based on selected drug-related ICD-10-AM codes (see the methods for the list of ICD-10-AM codes). Estimates of drug-related hospitalisations for this period are likely to be underestimated.
We provide numbers, age-standardised rates per 100,000 people (computed using the direct method based on the Australian Standard Population at 30 June 2001), and crude rates per 100,000 people (calculated using the Australian Bureau of Statistics' estimated resident population figures as at 30 June each year) of hospitalisations. Values for small numbers of hospitalisations (less than or equal to 5) were suppressed. In accordance with recommendations to ensure stability of age-standardised rates from sparse data, age-standardised rates were not calculated if the total number of hospitalisations was less than or equal to 10. Estimates presented for specific age-groups were computed only as crude rates per 100,000 people.
An accompanying online interactive data visualisation allows visitors to disaggregate data in many different ways, and to download these images. Visitors can view estimates disaggregated by drug, jurisdiction, remoteness, sex, age group and diagnosis, and as numbers or crude or age-standardised rates per 100,000 population (with 95% confidence intervals).
Findings
Trends in Drug-Related Hospitalisations among Australians
In 2018-19 there were 11.5 million hospitalisations in Australia's public and private hospitals. We have identified 61,780 hospitalisations with a drug-related principal diagnosis among Australians of all ages in 2018-19, equivalent to 0.5% of all hospitalisations. Relative to population size and adjusting for age distribution, we estimate that there were 251 drug-related hospitalisations per 100,000 people in 2018-19 (Figure 1).
The age-standardised rate of drug-related hospitalisations was relatively stable between 1999-00 and 2009-10. From 2010-11, we observed an increase in the age-standardised rate of drug-related hospitalisations from 199 to 272 hospitalisations per 100,000 people in both 2015-16 and 2016-17. The rate then decreased to 250 hospitalisations per 100,000 people in 2017-18, and remained similar in 2018-19 (251 hospitalisations per 100,000 people, p=0.53; Table 2).
Figure 1. Age-standardised rate (per 100,000 people) of drug-related hospitalisations for the total Australian population and for males and females, 1999-00 - 2018-19.
Remoteness area of usual residence (2018-19)
Remoteness area of usual residence was provided for all jurisdictions except Queensland from 2012-13 to 2017-18, and for all jurisdictions in 2018-19. For this reason, we present data by remoteness area in Australia for the 2018-19 reporting period only. We refer readers to the section on Drug-Related Hospitalisations by Jurisdiction for breakdown by remoteness region over time where data is available. Remoteness area could not be identified in 3.2% of hospitalisations in 2018-19.
In 2018-19, the majority of hospitalisations were among people residing in major cities (43,799 hospitalisations; 73% of hospitalisations with remoteness area identified), however the age-standardised rate was highest in outer regional areas (292 hospitalisations per 100,000 people). This was followed by remote and very remote areas (282 hospitalisations per 100,000 people), major cities (238 hospitalisations per 100,000 people) and inner regional areas (237 hospitalisations per 100,000 people).
Sex and Age Profile of Drug-Related Hospitalisations
In 2018-19, the age-standardised rate of drug-related hospitalisations was higher for males compared to females (259 versus 243 hospitalisations per 100,000 people, respectively), with 51% of hospitalisations occurring among males. This is a reversal of findings up until 2014-15 where the rate of drug-related hospitalisations was higher for females than males.
Figure 2. Crude rate (per 100,000 people) of drug-related hospitalisations for the Australian population, by age group and sex, 1999-00 - 2018-19.
Note: The rates for the 0-9 years age group are not presented due to sensitivity of the data.
The highest crude rate of hospitalisations has consistently been observed amongst the 20-29 age group, followed by the 30-39 age group (466 and 411 hospitalisations per 100,000 people in 2018-19, respectively). In 2018-19, these age groups accounted for the greatest percentage of drug-related hospitalisations (28% and 24%), followed by the 40-49 (18%), 10-19 (12%), 50-59 (9.2%), 60-69 (4.2%) and 70 and over (3.3%) age groups.
Table 1. Crude rate (per 100,000 people) of drug-related hospitalisations in 2018-19 and rate ratio and p-value for difference compared to 2017-18, by age group and sex
| 2018-19 versus 2017-18 | |||
|---|---|---|---|
| Age, Sex | Crude rate in 2018-19 | Rate ratio | P-value |
| 10-19,Female | 330 (320.5,339.0) | 0.93 (0.891,0.963) | <0.001 |
| 20-29,Female | 444 (434.0,453.5) | 1.01 (0.983,1.046) | 0.39 |
| 30-39,Female | 332 (323.8,340.4) | 1.00 (0.966,1.037) | 0.98 |
| 40-49,Female | 299 (290.5,307.2) | 1.00 (0.962,1.041) | 0.97 |
| 50-59,Female | 185 (178.1,191.6) | 0.97 (0.920,1.019) | 0.22 |
| 60-69,Female | 112 (106.5,117.9) | 1.02 (0.952,1.100) | 0.53 |
| 70 and over,Female | 83 ( 79.0, 88.2) | 1.00 (0.928,1.086) | 0.92 |
| 10-19,Male | 154 (148.3,160.6) | 0.95 (0.900,1.006) | 0.081 |
| 20-29,Male | 488 (478.3,498.5) | 1.04 (1.006,1.067) | 0.018 |
| 30-39,Male | 491 (481.2,501.7) | 1.05 (1.017,1.079) | 0.002 |
| 40-49,Male | 390 (380.2,399.5) | 1.01 (0.976,1.047) | 0.53 |
| 50-59,Male | 183 (175.8,189.6) | 1.00 (0.950,1.056) | 0.95 |
| 60-69,Male | 83 ( 78.3, 88.4) | 0.91 (0.834,0.986) | 0.022 |
| 70 and over,Male | 62 ( 57.6, 66.2) | 1.06 (0.963,1.177) | 0.22 |
Note: 95% confidence intervals for the crude rate and rate ratio are shown in brackets. Please refer to our methods document on 'Presentation of results' for interpretation of rate ratios. The estimates for the 0-9 years age group are not presented due to sensitivity of the data. Please also refer to our methods document on 'Scope of the data' and 'Coding of hospitalisations' for specifications of data selected and all exclusions.
There have been increases in the crude rate of drug-related hospitalisations across most age groups for both males and females from 1999-00 to 2018-19. The greatest increase has been observed in males aged 40-49 and 50-59, with rates of drug-related hospitalisations over two times higher in 2018-19 than in 1999-00. However, the highest rate of drug-related hospitalisations in 2018-19 was observed amongst the male 30-39 and 20-29 age groups, followed by the female 20-29 age group (491, 488, and 444 hospitalisations per 100,000 people, respectively; Figure 2). Compared with the previous year, there was a statistically significant increase in rate of drug-related hospitalisations among males aged 20-29 and 30-39 in 2018-19, but this was after a decrease in rates from 2016-17 to 2017-18. There was also a statistically significant decrease in rate of drug-related hospitalisations among females aged 10-19 and males aged 60-69 from 2017-18 to 2018-19 (Table 1).
Sex and age profile by remoteness area
Rates of drug-related hospitalisations were higher among males than females in major cities (250 per 100,000 people and 227 per 100,000 people, respectively) and remote and very remote (289 per 100,000 people and 274 per 100,000 people, respectively) areas (Figure 3). Conversely, rates of drug-related hospitalisations were higher in females than males in inner regional (249 per 100,000 people and 226 per 100,000 people, respectively) and outer regional (315 per 100,000 people and 270 per 100,000 people, respectively) areas.
Figure 3. Rate (per 100,000 people) of drug-related hospitalisations for the Australian population, by remoteness, sex and age group, 2018-19.
The highest rate of hospitalisations was observed among the 20-29 age group in all remoteness areas; however, the rates were higher in remote and very remote (614 hospitalisations per 100,000) and outer regional (595 hospitalisations per 100,000) areas compared to inner regional areas (475 hospitalisations per 100,000) and major cities (430 hospitalisations per 100,000). The rate of hospitalisations among the younger group (10-19 years) was also higher in the remote and very remote (417 hospitalisations per 100,000) and outer regional (335 hospitalisations per 100,000) areas compared to inner regional (253 hospitalisations per 100,000) and major cities (216 hospitalisations per 100,000). By contrast, in the major cities we have observed higher rate of hospitalisations in the older age groups; 60-69 and 70 and over than in other remoteness areas (105 and 79 hospitalisations per 100,000 people, respectively).
Drug-Related Hospitalisations by Drug
In 2018-19, the largest number of drug-related hospitalisations in the Australian population was attributable to amphetamines and other stimulants (15,265 hospitalisations, 63 per 100,000 people, 25% of all drug-related hospitalisations), followed by antiepileptic, sedative-hypnotic and antiparkinsonism drugs (e.g., benzodiazepines; 15%), opioids (14%), non-opioid analgesics (e.g., paracetamol, 11%), and cannabinoids ( 9.6%), with the remaining drug classes comprising less than 9.0% of drug-related hospitalisations each (Figure 4).
Figure 4. Age-standardised rate (per 100,000 people) of drug-related hospitalisations for the Australian population, by drug identified in the principal diagnosis, 1999-00 - 2018-19.
From 1999-00 to 2013-14, the highest age-standardised rate of drug-related hospitalisations was observed for a principal diagnosis indicating antiepileptic/sedative-hypnotic/antiparkinsonism drugs, followed typically by opioids. Increases in the rate of hospitalisations with a principal diagnosis indicating amphetamines and other stimulants (e.g., methamphetamine, MDMA) were observed from 2009-10 to 2015-16. The rate reached 64 hospitalisations per 100,000 in 2015-16, which was five times the rate in 2009-10 (13 hospitalisations per 100,000 people). Since 2014-15, the rate of hospitalisations for amphetamines and other stimulants has surpassed the rate observed for opioids.
There has been a decline in the rate of hospitalisations with a principal diagnosis related to antiepileptic, sedative-hypnotic and antiparkinsonism drugs, from a peak of 56 hospitalisations per 100,000 people in 2000-01 to 37 hospitalisations per 100,000 people in 2018-19. In 2018-19, over half of hospitalisations related to antiepileptic, sedative-hypnotic and antiparkinsonism drugs involved benzodiazepines (55%, 5,084 hospitalisations, 20 hospitalisations per 100,000 people). By contrast, the rate of non-opioid analgesic hospitalisations had shown a small increase over time.
The rate of cannabinoid-related hospitalisations increased from 1999-00 to 2018-19 (from 11 to 24 hospitalisations per 100,000 people, respectively). Other drug classes that have increased since 1999-00 are antipsychotics and neuroleptics, cocaine, and those coded as 'multiple drug use' (noting that the latter cases are likely to be a significant underestimate of hospitalisations involving multiple drugs). Although the number of hospitalisations related to cocaine remained relatively small (1,137 in 2018-19), the rate in 2018-19 was nearly six times the rate in 2010-11 (4.7 versus 0.8 per 100,000 people, respectively).
Compared with the previous year, 2018-19 saw a significant decrease in rates of hospitalisations with non-opioid analgesics (rate ratio=0.91; p<0.001), cannabinoids (rate ratio=0.94; p<0.001) or antiepileptic, sedative-hypnotic and antiparkinsonism drugs (rate ratio=0.95; p<0.001) identified under principal diagnosis, while there was a significant increase in hospitalisation rates with amphetamines and other stimulants (rate ratio=1.09; p<0.001), multiple drug use (rate ratio=1.16; p<0.001) or cocaine (rate ratio=1.33; p<0.001) identified (Table 2).
Table 2. Age-standardised rate (per 100,000 people) of drug-related hospitalisations in 2018-19 and rate ratio and p-value for difference compared to 2017-18, by drug type identified in the principal diagnosis
| 2018-19 versus 2017-18 | |||
|---|---|---|---|
| Drug | Age-standardised rate in 2018-19 | Rate ratio | P-value |
| All drugs | 251 (248.6,252.6) | 1.00 (0.993,1.015) | 0.53 |
| Amphetamines and other stimulants | 63 ( 61.7, 63.7) | 1.09 (1.067,1.116) | <0.001 |
| Antiepileptic, sedative-hypnotic and antiparkinsonism drugs | 37 ( 35.8, 37.3) | 0.95 (0.924,0.978) | <0.001 |
| Opioids | 33 ( 32.5, 34.0) | 0.97 (0.942,1.000) | 0.053 |
| Non-opioid analgesics | 29 ( 28.5, 29.9) | 0.91 (0.877,0.935) | <0.001 |
| Cannabinoids | 24 ( 23.4, 24.6) | 0.94 (0.910,0.976) | <0.001 |
| Multiple drug use | 22 ( 21.1, 22.3) | 1.16 (1.112,1.202) | <0.001 |
| Antipsychotics and neuroleptics | 18 ( 17.1, 18.2) | 0.99 (0.949,1.031) | 0.60 |
| Antidepressants | 17 ( 16.0, 17.0) | 0.97 (0.934,1.017) | 0.24 |
| Cocaine | 4.7 ( 4.41, 4.95) | 1.33 (1.212,1.456) | <0.001 |
| Volatile solvents | 3.0 ( 2.76, 3.19) | 1.01 (0.910,1.115) | 0.89 |
| Hallucinogens | 1.5 ( 1.30, 1.61) | 0.97 (0.821,1.141) | 0.70 |
Note: 95% confidence intervals for the age-standardised rate and rate ratio are shown in brackets. Please refer to our methods document on 'Presentation of results' for interpretation of rate ratios. Please also refer to our methods document on 'Scope of the data' and 'Coding of hospitalisations' for specifications of data selected and all exclusions.
Drug type by remoteness area of usual residence (2018-19)
In 2018-19, there were differences in rates of drug-related hospitalisations for specific drugs between remoteness area (Figure 5). Amphetamine and other stimulants was the most commonly identified drug group in all areas, with the highest age-standardised rate observed in outer regional areas (70 hospitalisations per 100,000 people) and lowest in inner regional areas (53 hospitalisations per 100,000 people). Remote and very remote areas had the highest rate of cannabinoid-related hospitalisations (59 per 100,000 people), which was similar to the rate of amphetamine-related hospitalisations in this region. Rate of cannabinoid-related hospitalisations in remote and very remote areas was nearly two times higher than in outer regional areas (32 per 100,000 people), over two times higher than in inner regional areas (25 per 100,000 people) and nearly three times higher than in major cities (21 per 100,000 people). Rates of hospitalisations related to non-opioid analgesics and volatile solvents were also highest in the remote and very remote areas (47 and 18 per 100,000 people, respectively), while cocaine and multiple drug use had the highest rates in major cities (5.8 and 23 per 100,000 people, respectively).
Figure 5. Age-standardised rate (per 100,000 people) of drug-related hospitalisations, by drug type identified in the principal diagnosis and remoteness area, for the Australian population in 2018-19.
Note: Age-standardised rates were not shown for remote and very remote areas with some drug types because the number of hospitalisations was less than or equal to 10. Please refer to our methods document for details.
Opioid-Related Hospitalisations
The following findings describe opioid-related hospitalisations due to illicit opioids (e.g., heroin), opioids used for the treatment of pain (e.g., oxycodone) and opioids used for the treatment of opioid dependence (e.g., methadone). In 2018-19, there were 8,377 hospitalisations with a principal diagnosis related to opioids (33 hospitalisations per 100,000 people). A slow but stable decrease in the rate of opioid-related hospitalisations has been observed since 2016-17. While there was a decrease in age-standardised rate of opioid-related hospitalisations in 2018-19 compared with previous year, the decrease was not statistically significant (p=0.053; Table 2).
Sex and age profile of opioid-related hospitalisations
There were more opioid-related hospitalisations among males than females in 2018-19 (38 versus 29 hospitalisations per 100,000 people, respectively), with 55% of opioid-related hospitalisations occurring among males. This trend has been consistent over time, although the difference in the age-standardised rate of opioid-related hospitalisations between males and females was smaller in 2018-19 as compared to 1999-00.
Figure 6. Crude rate (per 100,000 people) of opioid-related hospitalisations for the Australian population for females and males, by age group, 1999-00 - 2018-19.
Note: The rates for the 0-9 years age group are not presented due to sensitivity of the data.
In 2018-19, 26% of opioid-related hospitalisations occurred among the 40-49 age group (2,177 hospitalisations; 66 hospitalisations per 100,000 people), followed by the 30-39 age group (2,043 hospitalisations; 24%; rate of 56 hospitalisations per 100,000 people), 20-29 age group (1,344; 16%; rate of 37 hospitalisations per 100,000 people), 50-59 age group (1,124; 13%; rate of 36 hospitalisations per 100,000 people), 60-69 age group (814; 9.7%; rate of 31 hospitalisations per 100,000 people), and lastly those aged 70 and over age group (571; 6.8%; rate of 20 hospitalisations per 100,000 people).
There have been shifts in the age groups experiencing the greatest rate of opioid-related hospitalisations. In 1999-00, crude rates were highest in the 20-29 and 30-39 age groups (168 and 88 hospitalisations per 100,000 people, respectively). The rate of hospitalisations has, however, declined in these age groups over the course of monitoring. By contrast, opioid-related hospitalisations have increased among older Australians. The rate of opioid-related hospitalisations is over three times higher in 2018-19 compared to 1999-00 for the 50-59 age group (36 versus 11 hospitalisations per 100,000 people), about five times higher for the 60-69 age group (31 versus 6 hospitalisations per 100,000 people) and almost three times higher for those aged 70 and older (20 versus 7 hospitalisations per 100,000 people). Trends in opioid-related hospitalisations for males and females by age group follow a similar pattern (Figure 6).
Opioid-related hospitalisations by diagnosis
In 2018-19, nearly half (48%) of all opioid-related hospitalisations were due to opioid poisoning, 35% were due to opioid dependence and 17% were coded to other reasons (e.g., withdrawal, psychosis, harmful use or acute intoxication; Figure 7). See the visualisation tool for trends over time by diagnosis type, although it is important to note changes over time may partly reflect changes in coding practices.
Figure 7. Percentage of opioid-related hospitalisations for the Australian population, by diagnosis, 1999-00 - 2018-19.
Opioid poisoning-related hospitalisations by opioid type
ICD-10-AM coding means that the type of opioid involved in hospitalisations is only identified where the diagnosis relates to opioid poisoning; hospitalisations coded to other diagnosis types (e.g., opioid withdrawal) do not identify the specific opioid involved (see methods document for overview of diagnosis types). In this section, we present opioid-related hospitalisations where the diagnosis was opioid poisoning and the opioid involved was identified (comprising 48% of all opioid-related hospitalisations; see section on Opioid-related hospitalisations by diagnosis).
Natural and semi-synthetic opioids (e.g., oxycodone, morphine) were responsible for nearly half (46%) of all hospitalisations due to opioid poisoning in 2018-19. The rate of hospitalisations for natural and semi-synthetic opioids poisoning more than doubled from 1999-00 to 2017-18 (3.5 to 8.1 hospitalisations per 100,000 people, or 674 to 2,051 hospitalisations, respectively; Figure 8). The rate then decreased in 2018-19 (7.0 hospitalisations per 100,000 people) compared with 2017-18, (rate ratio=0.87; p<0.001; Table 3).
Figure 8. Age-standardised rate (per 100,000 people) of opioid poisoning-related hospitalisations for the Australian population, by opioid type, 1999-00 - 2018-19.
Table 3. Age-standardised rate (per 100,000 people) of opioid poisoning-related hospitalisations in 2018-19 and rate ratio and p-value for difference compared to 2017-18, by opioid type identified in the principal diagnosis
| 2018-19 versus 2017-18 | |||
|---|---|---|---|
| Drug | Age-standardised rate in 2018-19 | Rate ratio | P-value |
| Natural and semi-synthetic opioids | 7.0 (6.66,7.32) | 0.87 (0.813,0.924) | <0.001 |
| Heroin | 4.1 (3.81,4.32) | 1.28 (1.163,1.419) | <0.001 |
| Synthetic opioids | 2.6 (2.40,2.81) | 1.00 (0.898,1.116) | 0.98 |
| Methadone | 1.1 (0.94,1.21) | 1.18 (0.987,1.404) | 0.070 |
| Other and unspecified opioids | 1.0 (0.90,1.15) | 1.04 (0.870,1.235) | 0.69 |
Note: 95% confidence intervals for the age-standardised rate and rate ratio are shown in brackets. Please refer to our methods document on 'Presentation of results' for interpretation of rate ratios. Please also refer to our methods document on 'Scope of the data' and 'Coding of hospitalisations' for specifications of data selected and all exclusions.
The second most commonly cited opioid in 2018-19 was heroin, comprising 25% of all opioid poisoning-related hospitalisations. The rate of hospitalisations due to heroin poisoning was highest in 1999-00 (8.7 hospitalisations per 100,000 people), decreasing 70% by 2001-02 (2.6 per 100,000 people). From 2001-02 to 2017-18, the annual rate of hospitalisations where heroin poisoning was the principal diagnosis comprised 3.5 or fewer hospitalisations per 100,000 people each year. An increase in the rate was then observed from 2017-18 to 2018-19 (4.1 per 100,000 people; rate ratio=1.28; p<0.001; Table 3).
The third most common opioid type responsible for 16% of hospitalisations due to opioid poisoning in 2018-19 was synthetic opioids (e.g., fentanyl, tramadol). The rate of hospitalisations where poisoning involving synthetic opioids was the principal diagnosis increased from 0.3 per 100,000 people in 1999-00 to 2.6 per 100,000 people in 2018-19. Rates of hospitalisations were low for methadone and 'other and unspecified opioids' over the period of monitoring (<0.9 per 100,000 people), with even fewer hospitalisations involving opium (data not shown to protect confidentiality).
Opioid-related hospitalisations by remoteness area (2018-19)
In 2018-19, the rate of opioid-related hospitalisations was highest in major cities (34 hospitalisations per 100,000 people; 6,332 hospitalisations), followed by inner regional Australia (27 per 100,000 people; 1,144 hospitalisations), outer regional Australia (25 per 100,000 people; 500 hospitalisations) and it was lowest in remote and very remote areas (22 per 100,000 people; 108 hospitalisations; Figure 5).
Figure 9. Age-standardised rates of opioid poisoning-related hospitalisations for the Australian population, by remoteness and opioid type, 2018-19.
Note: Age-standardised rates were not shown for remote and very remote areas with some opioid types because the number of hospitalisations was less than or equal to 10. Please refer to our methods document for details.
In 2018-19, natural and semi-synthetic opioids were the leading cause of hospitalisations related to opioid poisoning in all remoteness areas (Figure 9). The highest rate was observed in outer regional Australia (9.5 hospitalisations per 100,000 people), followed by inner regional Australia (8.6 hospitalisations per 100,000 people), major cities (6.2 hospitalisations per 100,000 people) and remote and very remote (5.5 hospitalisations per 100,000 people). The rate of heroin poisoning-related hospitalisations was highest in major cities (4.4 hospitalisations per 100,000 people), three times the rate in inner regional Australia (1.5 hospitalisations per 100,000 people) and four times the rate in outer regional Australia (1.1 hospitalisations per 100,000 people). Age-standardised rate was not computed for heroin-related hospitalisations in remote and very remote Australia because the total number of hospitalisations was too small. Crude rate of heroin-related hospitalisations in remote and very remote Australia (2.0 hospitalisations per 100,000 people), however, was less than half that of major cities (4.4 hospitalisations per 100,000 people). By contrast, the rates of synthetic opioid-related hospitalisations were the second highest of the opioid types in outer regional, inner regional and remote and very remote Australia (3.9, 3.8 and 3.3 hospitalisations per 100,000 people, respectively). The rates of hospitalisations due to poisoning by methadone and other and unspecified opioids were low in major cities and regional Australia (below 1.3 per 100,000 people), while in remote and very remote areas there were less than or equal to 5 hospitalisations for each of these opioid types (hence estimates are not shown; Figure 9).
Amphetamine and Other Stimulant-Related Hospitalisations
The following findings describe amphetamine and other stimulant-related hospitalisations. Due to the coding system used, these hospitalisations may relate to methamphetamines, 3,4-methylenedioxymethamphetamine (MDMA, 'ecstasy'), pharmaceutical stimulants such as dexamphetamine, and other stimulants (e.g., caffeine).
In 2018-19, there were 15,265 hospitalisations (63 hospitalisations per 100,000 people) with a principal diagnosis related to amphetamines and other stimulants. There was a substantial increase in the rate of hospitalisations observed from 2009-10 to 2015-16, with the rate in 2015-16 five times the rate recorded in 2009-10 (64 compared to 13 hospitalisations per 100,000 people). The rate of hospitalisations in 2017-18 was 57 per 100,000 people, which represented two consecutive years of decline relative to 2015-16 yet remained elevated compared to rates observed from 1999-00 through 2014-15. In 2018-19, the rate of hospitalisations increased again compared with 2017-18 (rate ratio=1.09; p<0.001; Table 2), to 63 per 100,000 people.
Sex and age profile of amphetamine and other stimulant-related hospitalisations
In 2018-19, the rate of hospitalisations related to amphetamines and other stimulants in Australian males was nearly double the rate of females (81 versus 44 per 100,000 people), with 65% of hospitalisations occurring among males. Despite the changes in rates over time, the magnitude of the difference between males and females has remained similar.
Figure 10. Crude rate (per 100,000 people) of amphetamine and other stimulant-related hospitalisations for the Australian population for females and males, by age group, 1999-00 - 2018-19.
Note: Given the small numbers, the age groups 60-69 years, and 70 years and over are combined into the 60 years and over age group. Numbers for the 50-59 years, and the 60 years and over age groups in the earlier years are small and thus rates are suppressed to protect confidentiality. The rates for the 0-9 years age group are not presented due to sensitivity of the data.
In 2018-19, hospitalisations related to amphetamines and other stimulants were most common among Australians aged 30-39 (36%; 5,451 hospitalisations; 148 per 100,000 people), followed by the 20-29 age group (32%; 4,854 hospitalisations; 133 per 100,000 people), and the 40-49 age group (21%; 3,134 hospitalisations; 96 per 100,000 people). The 20-29 age group had the highest rate of amphetamine and other stimulant-related hospitalisations prior to 2016-17, but this had since been overtaken by the 30-39 age group. This change has been driven by males, with hospitalisations among females remaining largely comparable among the 20-29 and 30-39 age groups (Figure 10).
Amphetamine and other stimulant-related hospitalisations by diagnosis
In 2018-19, psychosis was the leading coded cause of amphetamine and other stimulant-related hospitalisations (45%; 6,838 hospitalisations, 28 per 100,000 people), followed by dependence (17%; 2,652 hospitalisations, 11 per 100,000 people, Figure 11). See the visualisation tool for trends over time by diagnosis type, although it is important to note changes over time may partly reflect changes in coding practices.
Figure 11. Age-standardised rate (per 100,000 people) of amphetamine and other stimulant-related hospitalisations for the Australian population, by diagnosis, 1999-00 - 2018-19.
Amphetamine and other stimulant-related hospitalisations by remoteness (2018-19)
Amphetamines and other stimulants was the most commonly identified drug group in all remoteness areas, with the highest rate observed in outer regional Australia (70 70 hospitalisations per 100,000 people) and lowest in inner regional (53 hospitalisations per 100,000 people; Figure 5).
Cannabinoid-Related Hospitalisations
Cannabinoids (including cannabis and synthetic cannabinoids) were identified as the principal diagnosis for 5,910 hospitalisations in 2018-19. This represents an increase from 2,084 hospitalisations in 1999-00. The rate in 2018-19 (24 per 100,000 people) was double the rate in 1999-00 (11 hospitalisations per 100,000 people). As stated in the section on Drug-Related Hospitalisations by Drug, the rate of cannabinoid-related hospitalisations decreased from 2017-18 to 2018-19 (rate ratio=0.94; p<0.001; Table 2).
Sex and age profile of cannabinoid-related hospitalisations
In 2018-19, males presented to hospital with a cannabinoid-related principal diagnosis nearly twice as often as females (3,607 versus 2,303 hospitalisations; 61% male). This trend has been relatively consistent over time. However, in the last two years we have observed a decrease in male hospitalisations (from 35 per 100,000 in 2016-17 to 33 and 29 per 100,000 in 2017-18 and 2018-19, respectively) while the rate for females has increased (15 per 100,000 in 2016-17 to 17 and 18 per 100,000 in 2017-18 and 2018-19, respectively).
In 2018-19, the highest rate of cannabinoid-related hospitalisations was recorded for the 20-29 age group (71 hospitalisations per 100,000 people; 44%), followed by the 30-39 (36 hospitalisations per 100,000 people; 22%) and 10-19 (28 hospitalisations per 100,000 people; 15%) age groups.
All age groups have recorded an increase in cannabinoid-related hospitalisations since 1999-00, with the greatest increase observed in the 20-29 age group (36 versus 71 hospitalisations per 100,000 people in 1999-00 versus 2018-19, respectively; Figure 12). However, in the last two years we have observed a continuing increase in rates for young females, particularly those aged 20-29 years, while rates in males aged 20-29 decreased. There were only small numbers of hospitalisations each year for those aged 70 years and over; thus, data for this age group are not shown to protect confidentiality. These age group trends are mostly consistent when studying males and females separately.
Figure 12. Crude rate (per 100,000 people) of cannabinoid-related hospitalisations for the Australian population for females and males, by age group, 1999-00 - 2018-19.
Note: Given the small numbers, the age groups 60-69 years, and 70 years and over are combined into the 60 years and over age group. Numbers for the 50-59 years, and the 60 years and over age groups in the earlier years are small and thus rates are suppressed to protect confidentiality. The rates for the 0-9 years age group are not presented due to sensitivity of the data.
Cannabinoid-related hospitalisations by diagnosis
In 2018-19, the majority of all cannabinoid-related hospitalisations were coded as psychosis (35%; 8.5 hospitalisations per 100,000 people) and dependence (34%; 8.0 hospitalisations per 100,000 people; Figure 13). See the visualisation tool for trends over time by diagnosis type, although it is important to note changes over time may partly reflect changes in coding practices.
Figure 13. Age-standardised rate (per 100,000 people) of cannabinoid-related hospitalisations for the Australian population, by diagnosis, 1999-00 - 2018-19.
Cannabinoid-related hospitalisations by remoteness (2018-19)
The highest rate of cannabinoids-related hospitalisations was observed in remote and very remote areas (59 hospitalisations per 100,000). This rate was two times the rate in regional Australia (32 and 25 hospitalisations per 100,000 people in outer and inner regional, respectively) and nearly three times the rate in major cities (21 hospitalisations per 100,000 people; Figure 5).
Cocaine-Related Hospitalisations
The following findings relate to hospitalisations due to cocaine. There were 4.7 hospitalisations per 100,000 people (1,137 hospitalisations) in 2018-19, with an upwards trend over the course of monitoring that was particularly prominent from around 2010-11 (0.8 hospitalisations per 100,000 people; Man et al., 2021). As stated in the section on Drug-Related Hospitalisations by Drug, the rate of cocaine-related hospitalisations increased from 2017-18 to 2018-19 (rate ratio=1.33; p<0.001; Table 2).
Sex and age profile of cocaine-related hospitalisations
In 2018-19, there were 7.6 cocaine-related hospitalisations per 100,000 males relative to 1.5 hospitalisations per 100,000 females (950 versus 187 hospitalisations; 84% male). The aforementioned increase in the rate of cocaine-related hospitalisations was driven mostly by an increase in hospitalisations among males (Figure 14A).
In 2018-19, the majority of cocaine-related hospitalisations occurred among people aged 30-39 (39%) or 20-29 (33%), with particular increases in the rate of cocaine-related hospitalisations over time in these age groups (Figure 14B).
Figure 14. Age-standardised rate (per 100,000 people) of cocaine-related hospitalisations for the Australian population by sex, 1999-00 - 2018-19 (A) and crude rate (per 100,000 people) of cocaine-related hospitalisations for the Australian population by age group, 1999-00 - 2018-19 (B).
Note: Numbers for age groups 50-59 years (before 2004-05), 60 years and over are small and thus rates are suppressed to protect confidentiality. The rates for the 0-9 years age group are not presented due to sensitivity of the data.
Cocaine-related hospitalisations by remoteness (2018-19)
In 2018-19, the rate of hospitalisations related to cocaine was highest in major cities (5.8 per 100,000 people), five times higher than in any other remoteness area (1.3 per 100,000 in remote and very remote areas, 0.91 per 100,000 in inner regional areas and 0.87 in outer regional areas; Figure 5).
Drug-Related Hospitalisations by Jurisdiction
The below sections describe trends in drug-related hospitalisations for each jurisdiction from 1999-00 to 2018-19. We encourage caution when interpretating some of these figures given the small number of hospitalisations for some drug types in less populous jurisdictions (e.g., Northern Territory, Tasmania). Data can be obtained on the number and rate (crude and/or age-standardised) of hospitalisations by sex, age group and drug type for each jurisdiction from the publicly-accessible online interactive data visualisation. Data on hospitalisations by diagnosis type are not available for jurisdictional analysis. Data by remoteness area is not reported for Australian Capital Territory as over 99.8% of the population reside in major cities and data on remoteness area for Queensland is only provided for 2018-19. Data by remoteness area is available for all other jurisdictions from 2012-13 to 2018-19. The following are links to the jurisdictional reports:
- New South Wales
- Australian Capital Territory
- Victoria
- Queensland
- Western Australia
- South Australia
- Tasmania
- Northern Territory
Funding
The Drug Trends program is funded by the Australian Government Department of Health under the Drug and Alcohol Program.
Acknowledgements
We would like to acknowledge the Australian Institute of Health and Welfare and jurisdictional data custodians for data from the National Hospital Morbidity Database.
We would also like to acknowledge the contribution of those who have been involved in past reporting on drug-related hospitalisations by Drug Trends, specifically: A/Prof Timothy Dobbins, Dr Amanda Roxburgh, and A/Prof Lucinda Burns.
Recommended citation
Man, N., Chrzanowska, A., Sutherland, R., Degenhardt, L. & Peacock, A. (2021). Trends in drug-related hospitalisations in Australia, 1999-2019. Drug Trends Bulletin Series. Sydney: National Drug and Alcohol Research Centre, UNSW Sydney.
Related Links
- Hospitalisations data visualisations: https://drugtrends.shinyapps.io/hospital_separations
- Hospitalisations methods document: https://ndarc.med.unsw.edu.au/resource-analytics/trends-drug-related-hospitalisations-australia-1999-2019
- For information on drug-induced deaths in Australia, go to: https://ndarc.med.unsw.edu.au/resource-analytics/trends-drug-induced-deaths-australia-1997-2019
- For more information on NDARC research, go to: http://ndarc.med.unsw.edu.au/
- For more information about the AIHW and NHMD, go to: https://www.aihw.gov.au/
- For more information on ICD coding go to: http://www.who.int/classifications/icd/en/ https://www.ihpa.gov.au/what-we-do/icd-10-am-achi-acs-current-edition
- For more research from the Drug Trends program go to: https://ndarc.med.unsw.edu.au/program/drug-trends
Contact us
Email: drugtrends@unsw.edu.au