
Key findings
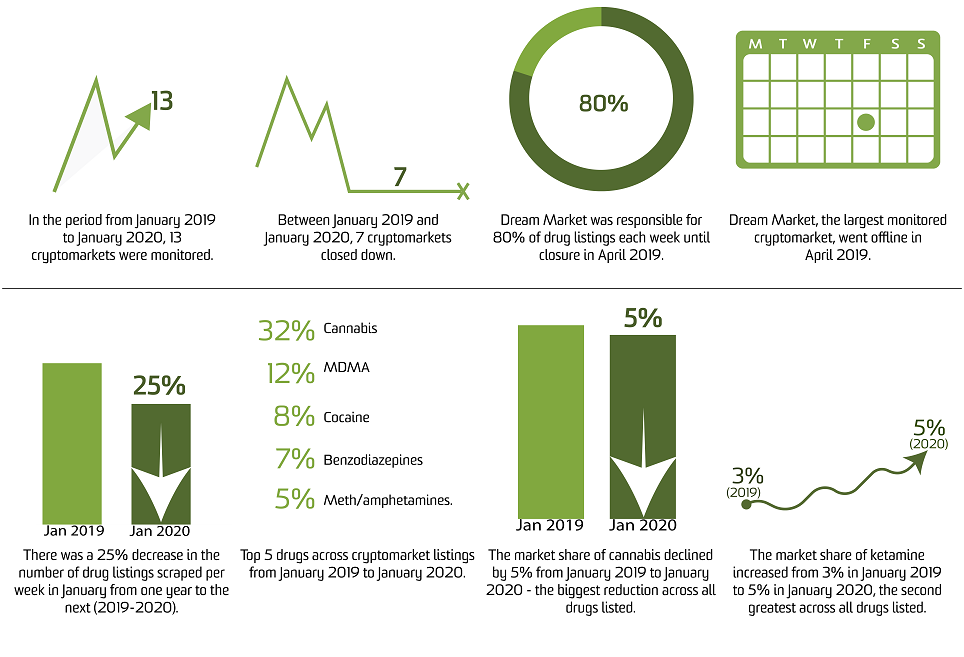
- From 1 January 2019 to 31 January 2020, 13 cryptomarkets were monitored, and seven cryptomarkets closed down.
- Dream Market was responsible for 80% of drug listings each week until closure on the 30 April 2019.
- Cannabis, MDMA, cocaine, benzodiazepines and meth/amphetamine were the five drugs accounting for the greatest percentage of listings (64%).
- The market share of cannabis declined from 32% in January 2019 to 27% in January 2020.
Background
This bulletin series reports on trends in the availability and type of substances sold on the internet via cryptomarkets over the last 12 months (new bulletin released every four months). The current bulletin focuses on analysis of listings from 1 January 2019 to 31 January 2020.
Drug Trends has identified, crawled (or ‘scraped’) , extracted, categorised and analysed drug listings on cryptomarkets on a weekly basis since 1 January 2014, formerly using VBA programming processes, and since 9 August 2018 using a range of programmed automated processes in Python that operate with minimal manual input. Further background and information regarding the methods are available for download.
|
Panel A. Terminology Cryptomarkets (‘darknet markets’) are anonymous online trading platforms that facilitate the purchasing of illicit goods and services via multiple sellers. |
Our reporting focuses only on identified English-language cryptomarkets selling drugs which have ≥100 drug listings and ≥1 vendor. For a historical record of marketplaces monitored by DNeT, we refer the reader to our interactive timeline.
Analyses are concentrated on listings on these marketplaces advertising the sale of illicit drugs (e.g., heroin), key licit drugs (e.g., alcohol, tobacco, e-cigarettes) and pharmaceutical medicines, as well as drug-related paraphernalia (e.g., needles and syringes, reagent test kits).
Following extraction of common text features across each listing (e.g., drug listing name, vendor name and the price in bitcoin or dollars), individual listings are categorised according to a pre-specified classification structure using a rules-based approach through text-matching in the first instance, followed by a long short-term memory (LSTM) artificial neural network (target predictive percentage 90%) that has been trained on historically categorised listings for those not matched through the former process (see methods for full details).
An accompanying public online interactive data visualisation is available, allowing viewers to interact with data collected over the total monitoring period. Data presented here comprise number of listings and number of vendors observed in a given week (see Panel A). These data can be considered reasonable estimates for trends in drug availability, as we cannot guarantee immediate identification and capture of cryptomarkets once they emerge. Further, data provided here can only be used as a proxy of drug availability on cryptomarkets: we have not translated to any metric that reflects the sale volume of a market or specific drug. See here for further discussion of caveats to interpretation.
There are various approaches to collecting, collating, categorising and analysing cryptomarket data, and inherent challenges in these processes. For this reason, we have attempted to be as transparent as possible about our procedures. Our monitoring is an ongoing process, requiring constant refinements to the various stages. We welcome feedback and suggestions so that we can continue to improve utility of these data and our reporting on them (drugtrends@unsw.edu.au).
Findings
Profile of Markets
The current bulletin reports for the time period 1 January 2019 to 31 January 2020. In that period, 13 cryptomarkets were monitored (Figure 1). Of these, seven markets were closed for the following purported reasons (internet sources hyperlinked on market name):
- Wall Street – A German law enforcement operation resulted in the shutdown of the market on 23 April 2019.
- Dream Market – On 4 March 2019, Dream Market administers announced the shutdown of the market on 30 April 2019. In this announcement, Dream Market declared they would move services to a partner market, however the provided onion URL to this marketplace was not operational. Due to a period of sustained Distributed Denial of Service attacks (DDoS; in which multiple sources are used to generate a large amount of traffic to an online service, thereby overwhelming its servers), resulting in the inability to run relevant automatic scripts, Dream Market was last monitored on 28 March 2019.
- Berlusconi – An Italian law enforcement operation resulted in the shutdown of the market on 26 September 2019.
- Cryptonia Market – For reasons unknown to the authors, Cryptonia Market ceased operations on 14 November 2019.
- Tochka – Due to an exit scam, Tochka shutdown on the 28 November 2019.
- CGMC – Due to market issues in undertaking withdrawals, CGMC ended operations on 2 May 2019.
- Apollon - Due to an exit scam, Apollon ended operations on 28 April 2019.
An additional market, Nightmare, was identified in this period but we were unable to monitor manually or via establishing scripts for automated scripts. Nightmare was closed on 26 July 2019 due to an exit scam.
Figure 1. Markets monitored from 1 January 2019 to 31 January 2020
Note: See our interactive timeline for a complete historical record of all cryptomarkets monitored since January 2014. Breaks indicate period where market crawling was not achievable. Width of bar is proportional to log of average listings. The width of the bar is proportional to the log of the number of drug listings observed in each week for each market.
The longest-established market in this monitoring period was Dream Market. Our monitoring of Dream Market commenced in November 2014. Over the total monitoring period of the market, it has had the greatest number of listings and number of vendors of all markets monitored until ceasing operations in April 2019 (see Figure 1 and 2). At its peak, the market hosted 68,179 drug listings and 2,823 vendors (scraping on 28 March 2019).
The shutdown of Dream Market resulted in a drop in the number listings, from 86,424 listings across markets monitored in final week of monitoring (28 March 2019) versus 22,089 listings across markets in the first week following cessation (4 April 2019). However, over time, smaller markets such as Empire Market, Apollon and Cryptonia Market increased in size (see Figure 2). For example, the average number of listings observed on Cryptonia Market increased by 12.9% in the month of September 2019 to the month of October 2019 before closure on 14 November 2019. Apollon hosted 21,282 drug listings on the 23 July 2019 before its closure on 28 January 2020, an increase from 4,759 (or 520%) since monitoring of this market commenced in 26 September 2019. The average number of listings observed on Apollon increased by 41.1% in the month of December 2019 to January 2020, with market closure at the end of January.
In the final week of this monitoring period (24 January 2020 – 31 January 2020), six marketplaces were monitored. The largest marketplace remaining was Empire Market (31,620 listings, 1,780 vendors at 23rd January 2020), despite experiencing prolonged periods of downtime (explaining interpolated data in Figure 2 below), followed by Dark Market (5,324 listings, 517 vendors on 30 January 2020). This downtime was due to DDoS (Distributed Denial of Service) attacks.
In total, there was a 12.6% change in the average number of drug listings across all marketplaces monitored observed in the months of December 2019 versus January 2020 (48,769 average listings per week from three markets versus 54,900 average listings per week from seven markets, respectively), and -25.2% change in the average number of drug listings observed in January 2019 (73,434 average listings per week from six markets) versus January 2020.
Figure 2. Total number of drug listings by marketplace from 1 January 2019 to 31 January 2020
Note: Complete interactive visualisation available here. Shaded area displays the total number of drug listing across all markets monitored at a given time. Caveats to this metric are outlined in the methods. Dashed lines indicate interpolated data over periods where a market could not be monitored. Note that the commencement and discontinuation of the coloured lines indicates the opening and closure of the named market.
Substance Availability
Market listings captured through cryptomarket monitoring have been categorised into drug classes according to this methodology.
Cannabis comprised the bulk of the listings identified across all markets over the total period of monitoring (32.3%), followed by MDMA (12.4%), cocaine (7.7%), benzodiazepines (7.3%), meth/amphetamine (5.7%) and opioids (excluding heroin; 5.6%) (see Table 1, Figure 3 and Figure 4). As evident from these figures, illicit substances (e.g., cannabis, MDMA, cocaine, meth/amphetamine) comprised the majority of substances listed on cryptomarkets. New psychoactive substances comprised 4.2% of listings, although challenges in their categorisation must be noted (see methods for further detail).
Figure 3. Percentage breakdown of listings by drug class over time from 1 January 2019 to 31 January 2020
Note: Complete interactive visualisation available here. Black vertical line indicates last date of monitoring for Dream Market before closure (28th March 2019). Missing data are interpolated in this figure. See here for information on how interpolated data were computed.
In terms of change in the percentage of drug listings across all markets disaggregated by drug (i.e., the ‘market share’ for each drug), there was <1% difference in the market share for each drug class across all markets when comparing the percentage of all listings observed in the months December 2019 and January 2020 (greatest magnitude -0.6% decline in PIEDS/weight loss drugs market share).
There was <5% market share percentage change for each drug across all markets when comparing the percentage of all listings observed in January 2019 and January 2020 (greatest magnitude -4.9% decline in cannabis market share).
In terms of change in the absolute number of listings per drug across all markets (i.e., the ‘market size’ for each drug) from the month of January 2019 to January 2020, there were notable declines in some of the larger categories including PIEDS/weight loss drugs (-43.4% decline in average number of listings to 2,232 in January 2020) and cannabis (-36.6% decline in average number of listings to 14,964 in January 2020) (see Figure 4 and Table 1).
Figure 4. Number of listing disaggregated by drug for all markets from 1 January 2019 to 31 January 2020
Note: Black vertical line indicates last date of monitoring for Dream Market before closure (28th March 2019). Missing data are interpolated in this figure. See here for information on how interpolated data were computed. MDA, tobacco, paraphernalia, e-cigarettes, PCP, inhalants and alcohol have not been included in the figure. To view these data see our interactive visualisation.
From the month of December 2019 to January 2020, there was a 121.0% increase for listings for drug paraphernalia, 68.7% increase in number of listings categorised as ‘other drugs’ (mostly comprising precursors (e.g., ephedrine) and drug listings with multiple drugs), and 49.9% increase for hallucinogenic mushrooms (see Table 1). These findings must be caveated, as these changes only reflect variation in a small number of listings (i.e., each category <1000 listings per week).
Figure 5 shows the breakdown of listings by drug type per market. These analyses show that most markets monitored listed an array of different drugs, although listings for two cannabis markets (CGMC and Cannazon) comprised >90% cannabis. There was also variability in the market share attributed to each drug across markets. For example, Dark Bay and Tochka had a greater market share of opioid listings relative to other markets, while Wall Street had a greater share of PIEDS/weight loss listings relative to other markets.
Figure 5. Drug composition of markets monitored from 1 January 2019 to 31 January 2020
Note: See Figure 1 and our interactive timeline for the duration of monitoring each market. This figure displays drug class percentage of all listings observed from 1st January 2019 to 31st January 2020) for each marketplace monitored. Missing data are interpolated in this figure. See here for information on how interpolated data were computed. Cannazon and CGMC are cannabis-specific cryptomarkets.
Table 1. Breakdown of total listings by drug class from 1 January to 31 January 2020
|
Drug Category |
% total listingsa |
Market share % changeb |
Market sizec |
Relative market size change (%)d |
|||
|
Jan 2019 – Jan 2020 |
Jan 2020 |
Dec 2019 – Jan 2020 |
Jan 2019 – Jan 2020 |
Jan 2020 |
Dec 2019 – Jan 2020 |
Jan 2019 – Jan 2020 |
|
|
Benzodiazepines |
7.3 |
6.6 |
- |
-0.2 |
3601 |
12.8 |
-27.3 |
|
Cannabis |
32.4 |
27.3 |
-0.5 |
-5.0 |
14964 |
10.5 |
-36.6 |
|
Cocaine |
7.7 |
8.5 |
-0.2 |
0.1 |
4656 |
10.0 |
-24.2 |
|
DMT |
1.0 |
1.3 |
0.1 |
0.6 |
729 |
25.5 |
36.5 |
|
GHB/GBL/1,4-BD |
0.4 |
0.5 |
- |
0.1 |
249 |
7.6 |
9.2 |
|
Hallucinogenic mushroom |
1.1 |
1.3 |
0.3 |
0.2 |
726 |
49.9 |
-11.8 |
|
Heroin |
2.7 |
3.0 |
- |
0.5 |
1660 |
14.1 |
-12.1 |
|
Ketamine |
3.4 |
4.8 |
0.4 |
1.7 |
2648 |
22.2 |
15.7 |
|
LSD |
4.1 |
4.8 |
0.2 |
0.1 |
2645 |
16.6 |
-6.8 |
|
MDA |
0.1 |
0.1 |
- |
- |
53 |
16.6 |
-27.3 |
|
MDMA |
12.4 |
14.4 |
-0.1 |
0.9 |
7887 |
11.8 |
-20.3 |
|
Meth/amphetamine |
5.7 |
6.8 |
-0.2 |
0.5 |
3756 |
9.0 |
-18.8 |
|
New psychoactive substances |
4.2 |
4.5 |
0.2 |
0.3 |
2486 |
16.7 |
-22.1 |
|
Opioids (excluding heroin) |
5.6 |
5.3 |
0.4 |
- |
2903 |
20.8 |
-24.9 |
|
Other drugs |
0.4 |
0.6 |
0.2 |
0.3 |
353 |
68.7 |
38.6 |
|
Other medicines |
3.6 |
3.3 |
-0.6 |
-0.1 |
1802 |
-4.8 |
-27.5 |
|
Paraphernalia |
0.2 |
0.1 |
- |
-0.1 |
71 |
121.0 |
-59.2 |
|
PCP |
- |
- |
- |
- |
4 |
- |
- |
|
PIEDs/weight loss |
4.9 |
4.1 |
-0.6 |
-1.3 |
2232 |
-0.8 |
-43.4 |
|
Psychostimulants & nootropics |
2.6 |
2.5 |
0.3 |
0.4 |
1388 |
29.8 |
-9.4 |
Note: Alcohol, e-cigarettes and tobacco and inhalants not shown due to small values. – Per cent suppressed for values <0.05. All values in table have been calculated using interpolated data. See here for information on how interpolated data were computed. aThis column displays the percentage of total listings across all marketplaces observed in the month of January 2020. bThese columns display the change in percentage of total listings attributed to each drug across all marketplaces in the stated months (e.g., from January in one year to January in the next year). cThis column displays the average number of weekly listings observed across all marketplaces in the month of January 2020. d These columns display the the relative change in the average number of weekly listings observed in the stated months (e.g., from January in one year to January in the next year).