fbpx Trends in the availability and type of drugs sold on the internet via cryptomarkets, June 2021 – May 2022 | NDARC - National Drug and Alcohol Research Centre

Trends in the availability and type of drugs sold on the internet via cryptomarkets, June 2021 – May 2022

Author: Nicola Man, Qingyuan Linghu, Max Pedersen, Raimondo Bruno, Rachel Sutherland, Monica J. Barratt and Amy Peacock

Last updated: 28 Jul 2022
Contact:
Key Findings on cryptomarkets monitored from 1st June 2021 to 31st May 2022

Drug Trends has identified, crawled (or ‘scraped’), extracted, categorised and analysed drug listings on cryptomarkets on a regular basis since 1 February 2014. This bulletin series reports on trends in the availability and types of drugs sold on the internet via cryptomarkets over a 12-month period (a new bulletin is released typically every 4 months). The current bulletin focuses on analysis of drug listings on cryptomarkets from 1st June 2021 to 31st May 2022.

An accompanying public online interactive data visualisation is available, allowing viewers to interact with data collected over the total monitoring period.
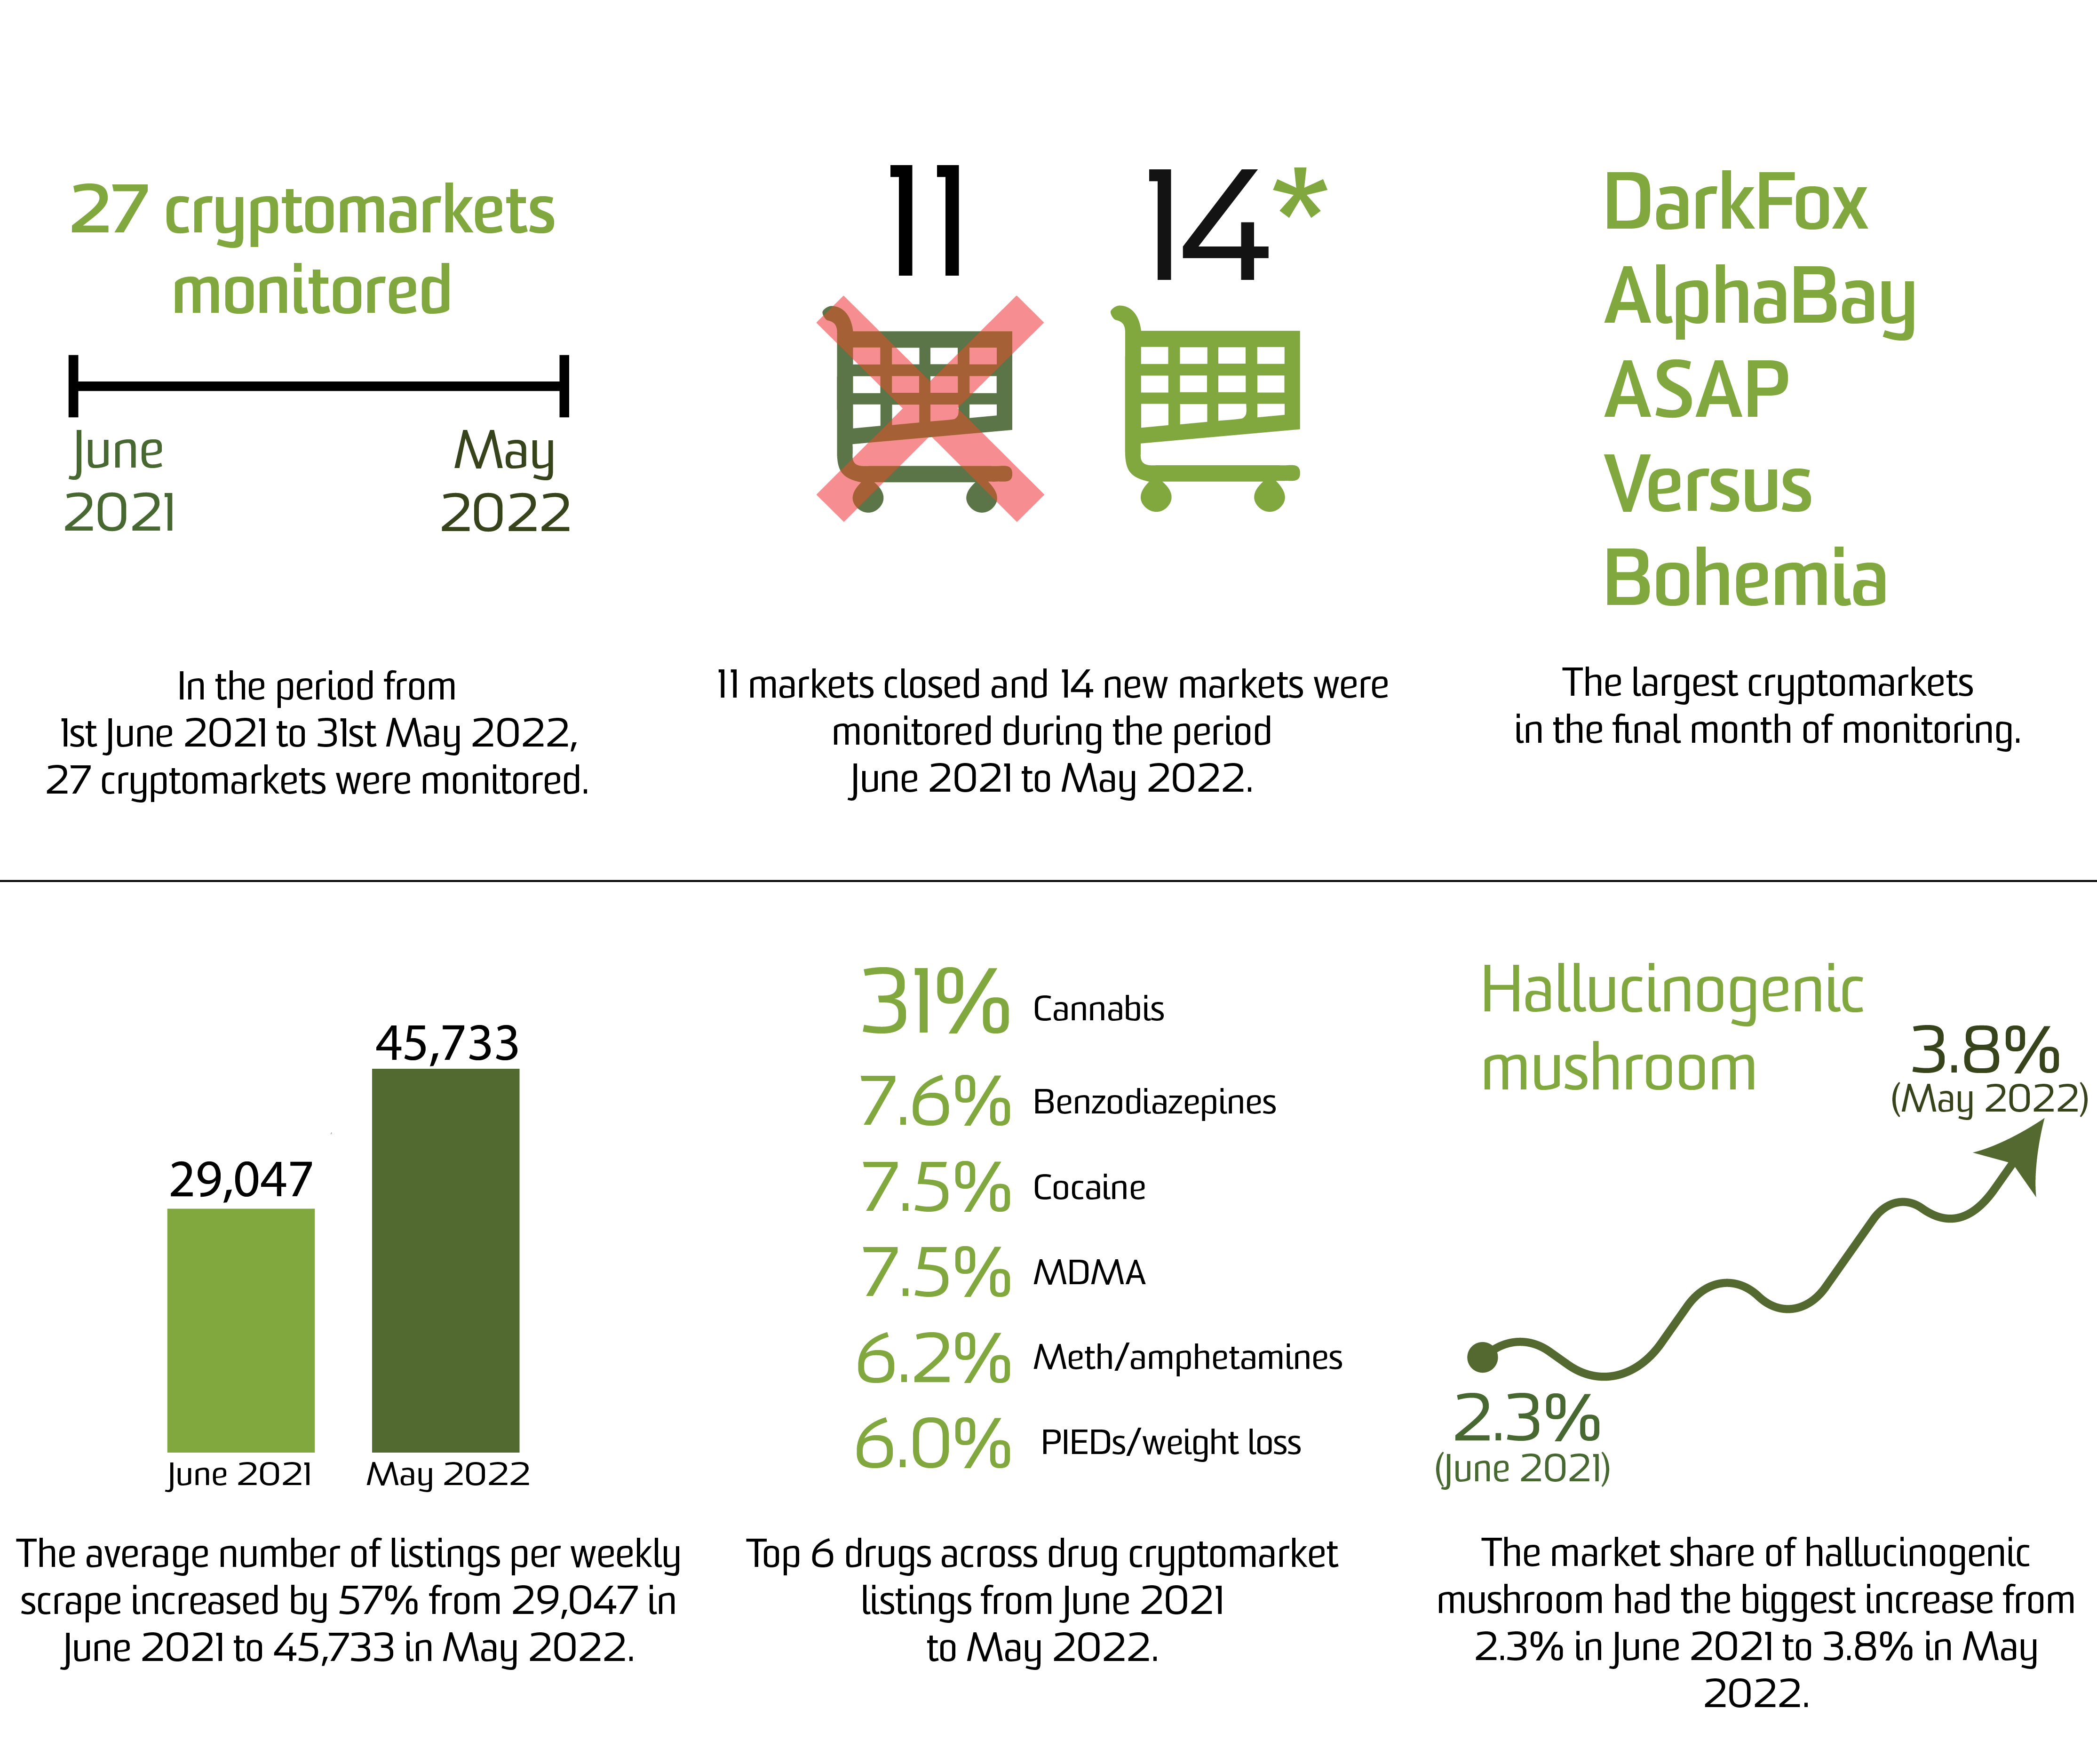
Key Findings

  • From 1st June 2021 to 31st May 2022, 27 cryptomarkets were monitored weekly, of which 11 closed before the end of the reporting period. We began monitoring 14 new cryptomarkets during this period.
  • The 27 cryptomarkets monitored from 1st June 2021 to 31st May 2022
  • In the final month of reporting, DarkFox, AlphaBay, ASAP, Versus and Bohemia were the largest cryptomarkets.
  • Only the largest markets by average number of weekly listings in the 12-month period are shown in the plot.

  • The number of drug listings across all monitored cryptomarkets increased by 65% in May 2022 (n= 45,733) as compared to June 2021 (n= 29,047), with increases noted across all drug classes. More recently, a 16% decline in total drug listings was observed from April to May 2022.
  • The largest percentage of listings from June 2021 to May 2022 were for cannabis (31%), followed by benzodiazepines (7.6%), cocaine (7.5%), MDMA (7.5%), meth/amphetamine (illicit) (6.2%), and PIEDs/weight loss (6.0%).
  • The market share of the different drug classes (i.e., percentage of total drug listings) remained relatively stable over the monitoring period.
  • The biggest increase was observed in the percentage of listings selling hallucinogenic mushrooms, which increased by 1.4% from 2.3% of all drug listings in June 2021 to 3.8% in May 2022. The greatest percentage decrease was observed for other medicines (4.5% of all drug listings in June 2021 to 3.6% in May 2022).